


 Gold's 365-Day EMA Streak Since Oct 2023 Faces Its First Real Test at $3,980 — Break or Bounce to $4,140?
  AI Memory Boom Sparks Global Chip Supply Crunch
  China’s AI Manufacturing Boom Masks Weak Consumer Economy, Citi Says
  How Donald Trump has changed the way diplomacy is done
  How AI prompting turned writerly description into an everyday skill
  Trump’s Iran Strategy: What Has Been Achieved After Three Months of Conflict?
  Today’s space race could turn fatal if we don’t agree on new rules
  With Iran and the US signing a peace deal, where does that leave Benjamin Netanyahu?


 - EconoTimes)


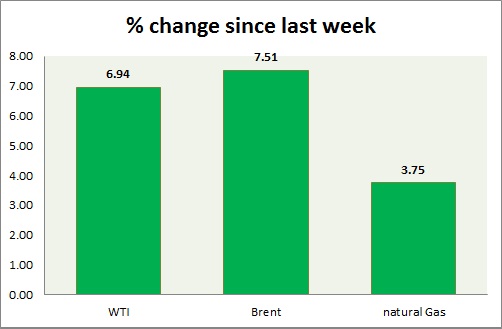
Energy segment continue to find sellers at rallies. Weekly performance at a glance in chart & table -
- Oil (WTI) - WTI selloffs continued as supply concerns persist. WTI has reached initial target of $42.5/ barrel further loss can't be ruled out and prices might move towards 2008 crisis low. Today is seventh consecutive decline. EIA reported an increase in inventory by 9.6 million barrels. WTI is currently trading at $42.2/ barrel, down nearly 3% today. Immediate support lies at 42, 38 and resistance at 46, 48.3.
- Oil (Brent) - Brent continued fall but at a moderate rate than peers. Brent-WTI spread is trading at $ 11, support lies at $8 and resistance at $13. Brent has reached the initial target of $53. Brent is trading at $53.3/barrel. Immediate support lies at 53, 50, 47 & resistance at 56, 58.4.
- Natural Gas - Natural gas is having quite a volatile week as markets waits for this week's inventory report as it fell below 5 year average. Natural Gas is currently trading at 2.83/mmbtu. Immediate support lies at 2.65 & resistance at 2.87.
|
WTI |
-6.08% |
|
Brent |
-2.06% |
|
Natural Gas |
4.04% |


