


 AI Memory Boom Sparks Global Chip Supply Crunch
  Today’s space race could turn fatal if we don’t agree on new rules
  China’s AI Manufacturing Boom Masks Weak Consumer Economy, Citi Says
  World Cup technology: from ref cams to AI analysts, cutting-edge research is changing the game
  How Donald Trump has changed the way diplomacy is done
  Goldman Sachs: US Dollar Likely to Stay Strong Despite Oil Price Retreat
  SpaceX Stock Gets $175 Target as Analysts See Massive Growth Ahead


 - EconoTimes)


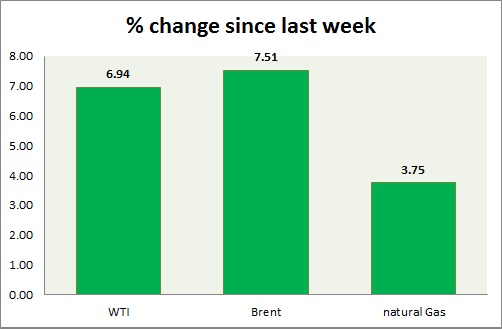
Energy segment is once again hit by selling as prices failed to break above key resistance last week. Weekly performance at a glance in chart & table
Oil (WTI) -
- WTI fell close to -1.5% today, as supply remains of greater concern than Middle East tension.
- WTI might continue to tread waters until further clarity appears.
- Bulls are retracing after reaching first bullish target of $51 and just short of second target at $54 last week.
- Target to the downside is coming around $45.
- WTI is currently trading at $48.25/barrel. Immediate support lies at 47.5-47, 44-43.7 and resistance at 51.7-52.1, 54-54.5, 58.7-59.2.
Oil (Brent) -
- Brent fell but performed worse than WTI.
- Brent-WTI spread narrowed after since last week, trading at $ 7.2/barrel, might go further down if Iran deal come out successful.
- Brent is trading at $55.4/barrel, down -1.35% today. Bias is downwards. Immediate support lies at 53 & resistance at 59.6-60.
Natural Gas -
- Natural gas is trading near range low. Price is lacking direction.
- Price pattern suggests that prices might drop down towards $2.44/mmbtu.
- Approaching summer is weighing on price, however talks of higher intake by power producers has kept the price supported.
- Natural Gas is currently trading at 2.65/mmbtu, flat today. Immediate support lies at 2.65, 2.55 & resistance at 2.74, 2.91, and 3.02.
|
WTI |
-0.12% |
|
Brent |
-1.20% |
|
Natural Gas |
-0.08% |


