


 World Cup technology: from ref cams to AI analysts, cutting-edge research is changing the game
  Sell the Bounce": Gold Rally Stalls Near $4165 as Fed Hawks Slam the Door on Rate Cuts — Targets $4000/$3600
  Today’s space race could turn fatal if we don’t agree on new rules
  SpaceX Stock Gets $175 Target as Analysts See Massive Growth Ahead
  AI Memory Boom Sparks Global Chip Supply Crunch
  Silver Cracks Key 365-Day EMA for First Time Since Feb 2024; Bears Eye $50 on Rallies
  J.P. Morgan Sees Potential Vestas Guidance Upgrade Amid Strong Wind Energy Demand


 - EconoTimes)


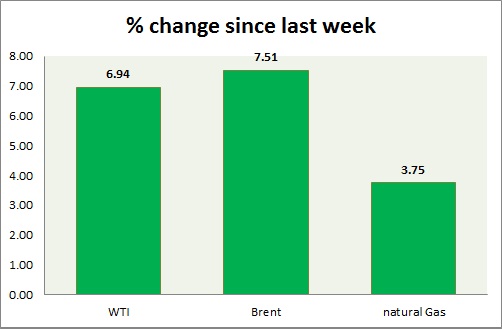
Energy segment's performance is mixed today, oils are up while gas is down. Weekly performance at a glance in chart & table
Oil (WTI) -
- WTI is trying to pose a comeback amid oversupply in US, however struggling to do so until.
- Bulls are lacking conviction and inventory continue to rise at record pace in US.
- WTI is currently trading at $51.4/barrel, up 1.2% today. Immediate support lies at $49.8-49.5, $47.5-47 and resistance at $54-54.5, and $58.7-59.2.
Oil (Brent) -
- Brent continue to trade sideways between $56 and $58.
- Brent-WTI spread flat today, trading at $6/barrel. Lacking conviction. Next week might provide fresh start.
- Brent is trading at $57.4/barrel. Downtrend remains in play. Immediate support lies at $54.5-53 area and resistance at $ 59.4-60.2 region.
Natural Gas -
- Natural gas is the worst performer this week. Current downtrend might push prices lower, however for now bids remain large around $2.54/mmbtu -$2.50/mmbtu zone.
- Price pattern suggests that prices might drop down towards $2.44/mmbtu. Short term traders are advised to book some profits and sell rallies next week. Weaker intake over summer might push price lower towards $2.2/mmbtu.
- Natural Gas is currently trading at 2.53/mmbtu, down 0.4% today. Immediate support lies at 2.50 area & resistance at $2.71, 2.81.
|
WTI |
+3.86% |
|
Brent |
+3.97% |
|
Natural Gas |
-6.16% |


