


 Gold's 365-Day EMA Streak Since Oct 2023 Faces Its First Real Test at $3,980 — Break or Bounce to $4,140?
  Bank Regulation Rollbacks in the U.S. and UK Could Increase Financial Risks, Study Warns
  With Iran and the US signing a peace deal, where does that leave Benjamin Netanyahu?
  How AI prompting turned writerly description into an everyday skill
  Silver Cracks Key 365-Day EMA for First Time Since Feb 2024; Bears Eye $50 on Rallies
  AI Memory Boom Sparks Global Chip Supply Crunch
  China’s AI Manufacturing Boom Masks Weak Consumer Economy, Citi Says
  Sell the Bounce": Gold Rally Stalls Near $4165 as Fed Hawks Slam the Door on Rate Cuts — Targets $4000/$3600
  SpaceX Stock Gets $175 Target as Analysts See Massive Growth Ahead


 - EconoTimes)


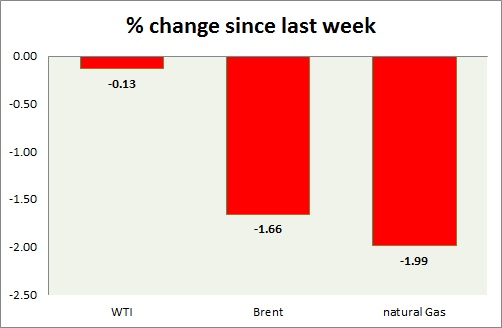
Energy pack is in consolidation mode. Weekly performance at a glance in chart & table.
Oil (WTI) -
- WTI moved higher taking cues from FED minutes as rate hike seem to be pushed and $58 provided the necessary support.
- WTI carved bearish doji in weekly chart and very bearish grave stone doji in daily chart. Further downside remains open if doji high is not taken out. RSI is also around 50 level resistance.
- WTI chart shows that prices might be curving a top.
- WTI is currently trading at $59.8/barrel. Immediate support lies at $55-54.6, $51.2-50 and resistance at $63-$65. $58 may continue to provide interim support.
Oil (Brent) -
- Brent moved similar to WTI, however slightly lagging.
- Brent-WTI dropped 10 cents today, currently trading at $6/barrel. Further downside remains open.
- Brent is trading at $65.8/barrel. Immediate support lies at $63.7-63.2, 61.8-61.4 area and resistance at $ 70 region.
Natural Gas -
- Natural gas in the short term has broken upward sloping trend line, suggesting that correction might be larger. Bulls are likely to use opportunity to buy at dips. Focus is on today's inventory report.
- Higher inventory will lead to lower price, so dip buying remains opportunity.
- Price target for bulls are coming close to $3.5/mmbtu, should support at $2.45 holds. Averaging it as low as possible would diminish risk.
- Natural Gas is currently trading at $2.95/mmbtu. Immediate support lies at $2.78 area & resistance at $3.32.
|
WTI |
-0.13% |
|
Brent |
-1.66% |
|
Natural Gas |
+1.99% |


