


 China’s AI Manufacturing Boom Masks Weak Consumer Economy, Citi Says
  Goldman Sachs: US Dollar Likely to Stay Strong Despite Oil Price Retreat
  J.P. Morgan Sees Potential Vestas Guidance Upgrade Amid Strong Wind Energy Demand
  Gold's 365-Day EMA Streak Since Oct 2023 Faces Its First Real Test at $3,980 — Break or Bounce to $4,140?
  Bank Regulation Rollbacks in the U.S. and UK Could Increase Financial Risks, Study Warns
  Trump’s Iran Strategy: What Has Been Achieved After Three Months of Conflict?
  AI Memory Boom Sparks Global Chip Supply Crunch
  With Iran and the US signing a peace deal, where does that leave Benjamin Netanyahu?


 - EconoTimes)


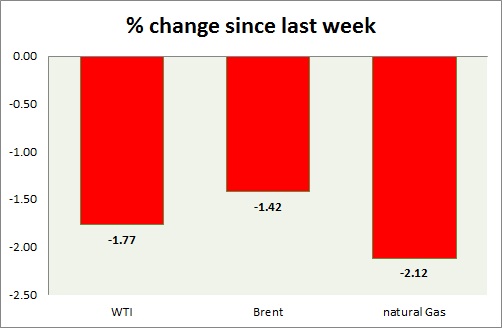
Energy pack is taking a hit today amid stronger dollar. Weekly performance at a glance in chart & table.
Oil (WTI) -
- WTI traded as high as $60, however failed once more to clear above. Declined towards $58/barrel in New York session.
- WTI carving several bearish doji in weekly chart and in daily chart. Further downside remains open if doji high is not taken out.
- WTI chart shows that prices might be curving a top. $58 support area, proving to be crucial.
- WTI is currently trading at $58.8/barrel. Immediate support lies at $55-54.6, $51.2-50 and resistance at $63-$65. $58 may continue to provide interim support.
Oil (Brent) -
- Brent move is similar to WTI, however weaker. Supply still remains at least 2 million barrels/day above demand.
- Brent-WTI lost 20 cents today, currently trading at $6/barrel. Brent might do well compared to WTI this week.
- Brent is trading at $64.6/barrel. Immediate support lies at $63.7-63.2, 61.8-61.4 area and resistance at $ 70 region.
Natural Gas -
- Natural gas consolidating near $2.78 support area. A break below would dent bullish momentum for the time being. As of now further downside seems likely.
- Price target for bulls are coming close to $3.5/mmbtu, should support at $2.45 holds. Averaging it as low as possible would diminish risk.
- Natural Gas is currently trading at $2.82/mmbtu. Immediate support lies at $2.78, $2.68 area & resistance at $3.04, $3.32.
|
WTI |
-1.77% |
|
Brent |
-1.42% |
|
Natural Gas |
-2.12% |


