


 How AI prompting turned writerly description into an everyday skill
  With Iran and the US signing a peace deal, where does that leave Benjamin Netanyahu?
  Bank Regulation Rollbacks in the U.S. and UK Could Increase Financial Risks, Study Warns
  Today’s space race could turn fatal if we don’t agree on new rules
  J.P. Morgan Sees Potential Vestas Guidance Upgrade Amid Strong Wind Energy Demand
  Gold's 365-Day EMA Streak Since Oct 2023 Faces Its First Real Test at $3,980 — Break or Bounce to $4,140?
  China’s AI Manufacturing Boom Masks Weak Consumer Economy, Citi Says
  World Cup technology: from ref cams to AI analysts, cutting-edge research is changing the game
  AI Memory Boom Sparks Global Chip Supply Crunch


 - EconoTimes)


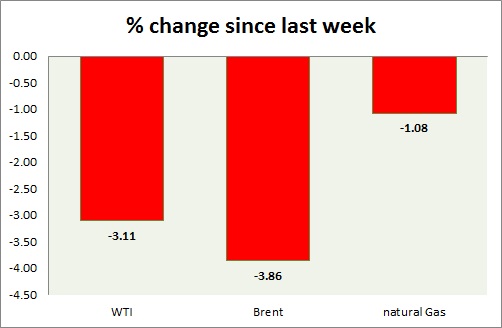
Energy pack is consolidating with downside bias. Weekly performance at a glance in chart & table.
Oil (WTI) -
- WTI has broken below $58 interim resistance and bounce back was halted at $59 level today.
- WTI carving several bearish doji in weekly chart and in daily chart. Further downside remains open if doji high is not taken out.
- WTI chart shows that prices might be curving a top. Further downside is likely.
- WTI is currently trading at $58/barrel. Immediate support lies at $55-54.6, $51.2-50 and resistance at $63-$65.
Oil (Brent) -
- Brent is a bigger loser today than WTI as OPEC keep producing crude at record levels.
- Brent-WTI lost 100 cents today, currently trading at $5/barrel.
- Brent is trading at $63/barrel. Immediate support lies at 61.8-61.4 area and resistance at $ 70 region.
Natural Gas -
- Natural gas has bounced back from $2.78 support, however rally was halted at $2.92.
- Price target for bulls are coming close to $3.5/mmbtu, should support at $2.45 holds. Averaging it as low as possible would diminish risk.
- Natural Gas is currently trading at $2.85/mmbtu. Immediate support lies at $2.78, $2.68 area & resistance at $3.04, $3.32.
|
WTI |
-3.11% |
|
Brent |
-3.86% |
|
Natural Gas |
-1.08% |


