


 ETH Stands Alone Bullish; BTC, SOL, XRP, BNB Neutral
  FxWirePro: USD/CAD falls after BoC rate hold and weak U.S. producer inflation
  Gold Loses Steam After Strong U.S. Retail Sales
  FxWirePro: GBP/USD hits one-month high, scope for further upside
  FxWirePro: GBP/NZD gains some upside momentum but still bearish
  AUDJPY Bullish Surge: Strong Australian Dollar Fuels Fresh Upside as Pair Holds Above 113.50 and All EMAs Align
  FxWirePro: EUR/AUD outlook weaker on renewed downside pressure
  NZDJPY Bullish Surge: Strong Kiwi Ignites Fresh Upside as 94 Support Holds and All EMAs Align


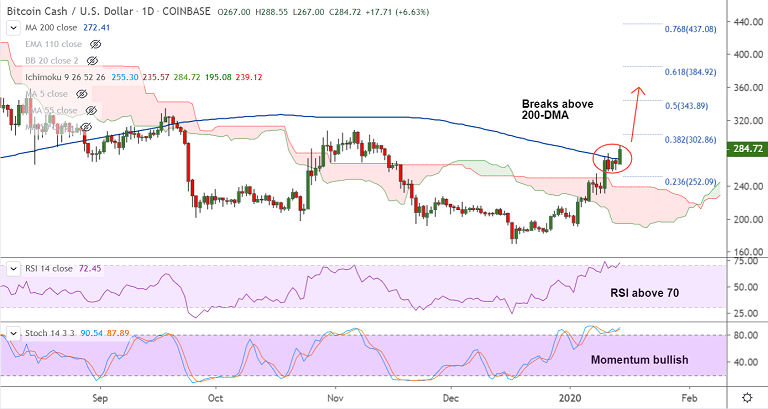
BCH/USD chart - Trading View
Exchange - Coinbase
Technical Analysis: Bias turning Bullish
GMMA Indicator: Major Trend - Turning bullish; Minor Trend - Strongly bullish
Overbought/ Oversold Index: Overbought
Volatility: Rising
Support: 272.40 (200-DMA); Resistance: 302.86 (38.2% Fib)
BCH/USD spikes on the day, trades 5.94% higher on the day at 282.82 at around 10:20 GMT.
The pair has broken above 200-DMA and technical studies have turned bullish.
Price action has broken above major moving averages and daily cloud, momentum with the bulls.
GMMA shows bullish shift in short-term trend with short-term moving averages crossing over long-term moving averages.
Further, the longer-term moving averages are also turning which if successful will see a new bull run.
For now, close above 200-DMA eyes next major hurdle at 38.2% Fib at 302.86 ahead of upper BB (weekly) at 323.82.
Failure to hold break above 200-DMA will see sideways grind. Retrace below 200H MA (252) negates bullish bias.


