


 FxWirePro: USD/CAD falls after BoC rate hold and weak U.S. producer inflation
  FxWirePro: USD/JPY uptrend loses steam, remains on bullish path
  ETH Stands Alone Bullish; BTC, SOL, XRP, BNB Neutral
  Gold Loses Steam After Strong U.S. Retail Sales
  FxWirePro: GBP/USD hits one-month high, scope for further upside
  FxWirePro- Woodies pivot (Major)
  FxWirePro:EUR/NZD stuck In narrow ranges, focus on near term support


, overbought oscillators may cap gains - EconoTimes)


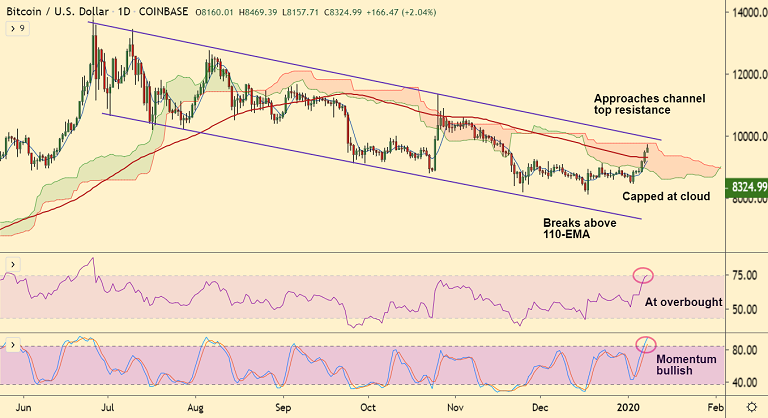
BTC/USD chart - Trading View
Exchange - Coinbase
Technical Analysis (Daily): Near-Term Bullish
GMMA Indicator: Major Trend - Neutral; Minor Trend - Bullish
Overbought/ Oversold Index: Overbought
Volatility: Rising
Support: 8013 (110-EMA); Resistance: 8533 (cloud top)
Major Candlestick Patterns: Potential Three White Soldiers (Daily)
BTC/USD has edged lower from session highs at 8469.39 and was trading 1.90% higher at 8311 at around 04:30 GMT. The pair is on track to form a bullish 3 White Soldiers pattern which if successfully completed will buoy prices higher.
Price action has shown a breaks above 23.6% Fib retracement of 13868.44 (June 26 High) to 6430 (Dec 18 Low) at 8185. The pair is extending break above 110-EMA which has now turned immediate support at 8013.
The pair has approached stiff resistance zone 8530-8750. Price action continues in sloping channel pattern and decisive breakout at channel top will see fresh upside momentum. Gains till 61.8% Fib at 11026 cannot be ruled out if the pair manages to break 200-DMA resistance at 9206.
Price action is above the upper Bollinger Band. On the intraday charts, a bearish RSI divergence on hourly charts raises scope for minor pull backs. Adding to the pressure are overbought oscillators which could limit upside and force sideways trade.


