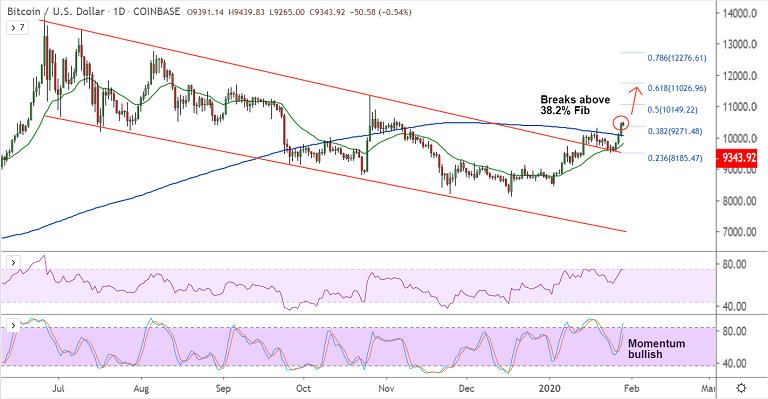
BTC/USD chart - Trading View
Exchange - Coinbase
Technical Analysis: Bias bullish
GMMA Indicator: Major Trend - Bullish; Minor Trend - Bullish
Overbought/ Oversold Index: Neutral
Volatility: Rising
Support: 9271 (38.2% Fib); Resistance: 9850 (trendline)
BTC/USD was consolidating previous session's gains, bias remains bullish.
The pair was trading 0.37% lower on the day at 9362 at around 04:10 GMT, after closing 5.60% higher in the previous session.
Price action has broken above 38.2% Fib at 9271 to hit 12-week high at 9439.
The pair has confirmed 200-DMA breakout and technical indicators are strongly bullish.
'Golden Cross' (bullish 50-DMA crossover on 200-DMA) confirmed on the 2H charts supports upside bias.
Next major hurdle lies at 9850 (trendline) ahead of weekly upper Bollinger band at 9948 and then the crucial 10,000 mark.