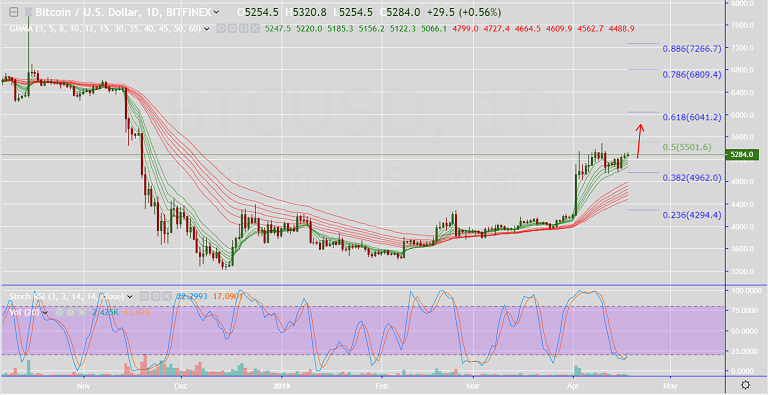
- BTC/USD extends marginal gains above 5-DMA, trades 0.75% higher at 5294 at 0940 GMT
- GMMA indicator shows short-term averages are above longer-term averages and edging higher
- Price action has edged above daily cloud and 200-DMA. However, technical indicators do not support upside for now.
- Also Doji formation on previous week's candle keeps scope for downside.
- Immediate resistance is seen at 5370 (trendline), break above targets 5501 (50% Fib)
- Retrace below 200-DMA negates the bullish bias
EIP-8061 estimates higher exit and consolidation capacity in a 36 million ETH stake scenario. Its Nov. 1, 2026, date is a review deadline, not a network activation date.