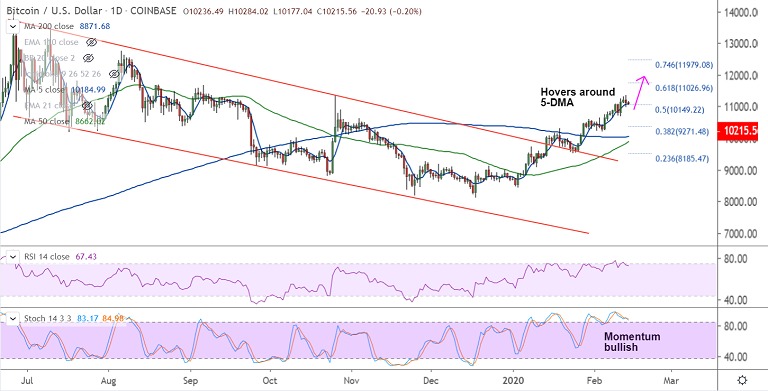
BTC/USD chart - Trading View
Exchange - Coinbase
Technical Analysis: Bias Bullish
GMMA Indicator: Major Trend - Bullish; Minor Trend - Neutral
Overbought/ Oversold Index: Overbought
Volatility: Shrinking
Support: 10186 (5-DMA); Resistance: 10,540 (Oct 26 high)
BTC/USD was trading largely rangebound in the Asian trade, with session highs at 10284 and lows at 10177.
Yesterday's correction has paused and the pair has held above the crucial 10,000 mark.
5-DMA has turned flat, Stochastics RSI has rolled over from overbought levels and is biased lower.
Major trend in the pair is bullish, overbought oscillators could add some downside pressure.
Break below 5-DMA (10186) finds next major support at 200H MA at 9985.
Violation at 200H MA to see near-term weakness. Dip till 21-EMA at 9617 likely.