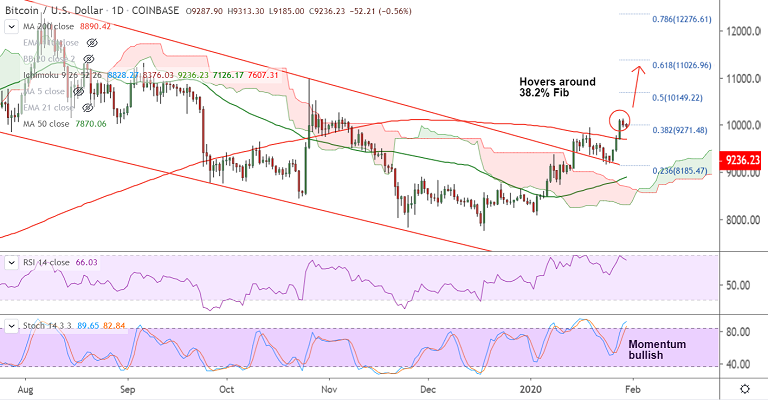
BTC/USD chart - Trading View
Exchange - Coinbase
Technical Analysis: Bias Bullish
GMMA Indicator: Major Trend - Bullish; Minor Trend - Bullish
Overbought/ Oversold Index: Overbought
Volatility: Rising
Support: 8890 (200-DMA); Resistance: 9417 (Upper BB)
Bitcoin is showing a minor correction after strong upside rally for 3 consecutive days.
The pair was trading slightly weaker on the day, extending previous sessions losses.
BTC/USD was trading 0.44% lower on the day at 9245 at around 02:50 GMT, bias remains bullish.
GMMA indicator has shown a shift in minor and major trend. Bias remains bullish as long as pair holds 200-DMA support.
Technical indicators on the intraday charts also do not show any major signs of reversal.
Volatility is rising and resumption of upside will see test of Upper BB at 9417 ahead of trendline resistance at 9825.
Break below 200-DMA (8890) will change near-term dynamics.