


 ETH Stands Alone Bullish; BTC, SOL, XRP, BNB Neutral
  GBPJPY Bullish on Consolidation: Holds Above 216 After 218 Top – Buy Dips at 217 Targeting 220
  FxWirePro: AUD/USD edges lower, but bullish outlook persists
  FxWirePro: USD/CAD falls after BoC rate hold and weak U.S. producer inflation
  NZDJPY Bullish Surge: Strong Kiwi Ignites Fresh Upside as 94 Support Holds and All EMAs Align
  FxWirePro: USD/JPY uptrend loses steam, remains on bullish path
  FxWirePro:EUR/NZD dips below lower range, bearish bias increases
  FxWirePro: AUD/USD remains buoyant, looks to extend gains
  AUDJPY Bullish Surge: Strong Australian Dollar Fuels Fresh Upside as Pair Holds Above 113.50 and All EMAs Align
  FxWirePro: EUR/AUD outlook weaker on renewed downside pressure


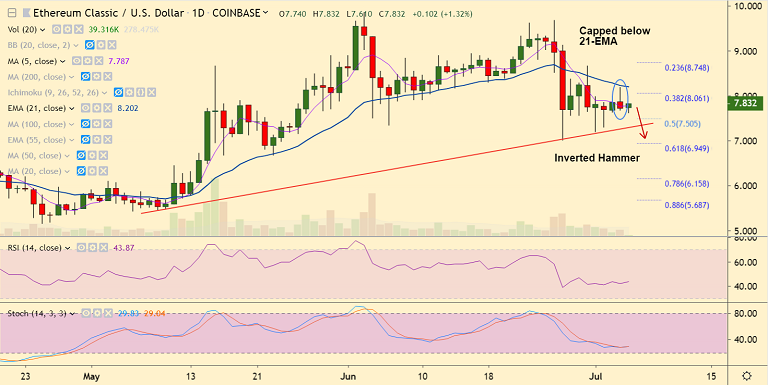
ETC/USD chart - Trading View
Exchange - Coinbase
Support: 7.30 (trendline); Resistance: 8.20 (21-EMA)
Technical Analysis: Bias Neutral to slightly bearish
Ethereum Classic is extending sideways, scope for downside.
ETC/USD was trading at 7.799 at 10:45 GMT, up 0.91% at the time of writing.
Technical studies are tilting towards a bearish bias, price action remains capped below 21-EMA.
A bearish 'Inverted Hammer' formation on Thursday's candle raises scope for weakness.
RSI is well below 50 level and Stochs show bearish momentum. Dip till trendline support at 7.30 likely.
Violation at trendline support will accentuate downside. Next major supports lie at 6.95 (61.8% Fib) and then 6.67 (May 23 low).
Decisive break above 21-EMA could negate near-term bearishness.
For details on FxWirePro's Currency Strength Index, visit http://www.fxwirepro.com/currencyindex.


