


 FxWirePro- Major Crypto levels and bias summary
  Crypto Pair Action Bias: ETHUSD Stands Out as the Bullish Pair to Watch
  AUDJPY Volatile After Massive Sell-Off: Sell Rallies at 113, Targeting 110 as Bearish Momentum Surges
  FxWirePro- Major Crypto levels and bias summary
  Crypto Action Bias: ETHUSD Stands Out as the Bullish Pair to Watch
  FxWirePro: GBP/AUD bears maintain upper hand
  FxWirePro: GBP/AUD drifts lower after BOE rate decision
  Nikkei Surges Past 65,000 on Suspected Yen Weakness: Tech Giants Like Advantest and NEC Lead Explosive Gains
  FxWirePro- Woodies pivot (Major)
  FxWirePro: USD/CNY dips to hit three year low,scope for further downside
  JPY Currency Meter Signals: NZDJPY Bullish (+25) vs CHFJPY (-100) – These Pairs Could Move Next


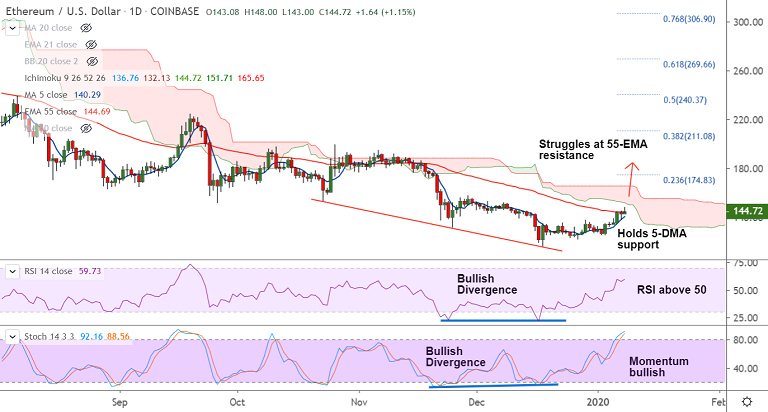
ETH/USD chart - Trading View
Exchange - Coinbase
Technical Analysis: Near-Term Bullish
GMMA Indicator: Major Trend - Bearish; Minor Trend - Bullish
Overbought/ Oversold Index: Overbought with scope to run further
Support: 140.29 (5-DMA); Resistance: 151.71 (Cloud base)
ETH/USD was trading 1.17% higher on the day at 144.77 at 05:40 GMT, after closing 0.77% lower in the previous session.
The pair has formed a 'hammer' pattern on Tuesday's candle suggesting buying pressure at lows.
55-EMA is proving a tough barrier. Price has slipped lower from session highs at 148 and is hovering around 55-EMA (currently at 144.70).
Technical indicators support gains. Volatility is rising and decisive breakout at 55-EMA will see gains.
MACD supports upside and histogram is well in the positive territory. +ve DMI dominance and rising ADX support gains.
Bullish divergence seen on RSI and Stochastics raises scope for upside. Breakout at 55-EMA finds next major hurdle at daily cloud (151.71).
5-DMA is immediate support at 140.29. Break below 21-EMA negates near-term bullish bias.


