


 FxWirePro: EUR/AUD outlook weaker on renewed downside pressure
  GBPJPY Bullish Surge: Strong Pound Ignites Fresh Upside on Fed-BOE Policy Divergence as All EMAs Align
  NZDJPY Bullish Surge: Strong Kiwi Ignites Fresh Upside as 94 Support Holds and All EMAs Align
  Major Pair Action Bias: Extremely Bullish Surge Powers GBPUSD & NZDUSD as Bullish Momentum Ignites
  AUDJPY Bullish Surge: Strong Australian Dollar Fuels Fresh Upside as Pair Holds Above 113.50 and All EMAs Align
  Gold Loses Steam After Strong U.S. Retail Sales
  FxWirePro- Woodies pivot (Major)
  JPY Action Bias: Extremely Bullish Surge Ignites Across NZD, GBP & AUD
  ETH Stands Alone Bullish; BTC, SOL, XRP, BNB Neutral


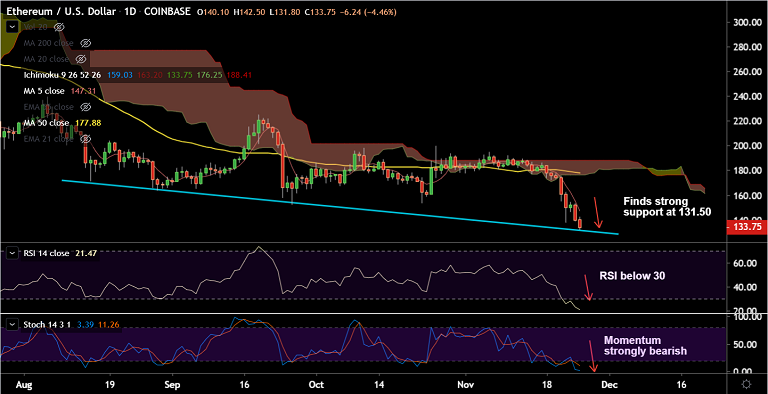
ETH/USD chart - Trading View
Exchange - Coinbase
Support: 131.50 (Trendline support); Resistance: 141.35 (78.6% Fib)
Technical Analysis: Bias strongly Bearish
ETH/USD is extending previous week's weakness, trades 4.96% lower on the day at 133.19 at 06:00 GMT.
The pair has hit 8-month lows below the $140 mark and more downside on charts.
Technical indicators are strongly bearish. Major and minor trend are bearish as evidenced by GMMA indicator. Volatility is rising.
Price action has broken below 78.6% Fib at 141.35, is on track for further weakness.
Strong trendline support is seen at 131.50. Break below will open up downside.
Next major support is seen at 122.75 (Mar 4th low), ahead of 112.96 (88.6% Fib).


