ETH/USD chart - Trading View
Exchange - Coinbase
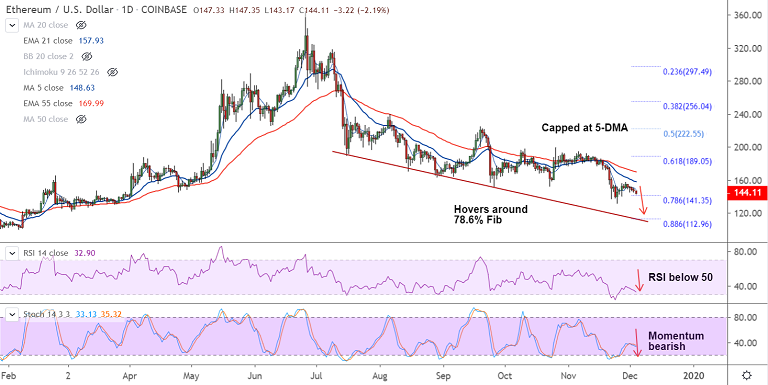
Support: 141.35 (78.6% Fib); Resistance: 148.60 (5-DMA)
Technical Analysis: Bias Bearish
ETH/USD is extending downside for the 5th straight session, bias remains bearish.
The pair has hit fresh weekly lows at 143.17 and has edged slightly higher at the time of writing.
At around 06:20 GMT, the pair was trading at 143.90, down 2.33%, after closing 1.10% lower in the previous session.
Bears largely in control, have ignored the 'Spinning Top' formation on the previous session's candle.
Upside remains capped below 5-DMA and technical indicators support further downside.
Stochs, RSI and 5-DMA are biased lower with room to fall further. ADX also supports weakness.
Break below 78.6% Fib support (141.35) could see dip till 130.49 (lower BB) ahead of 113 (88.6% Fib).