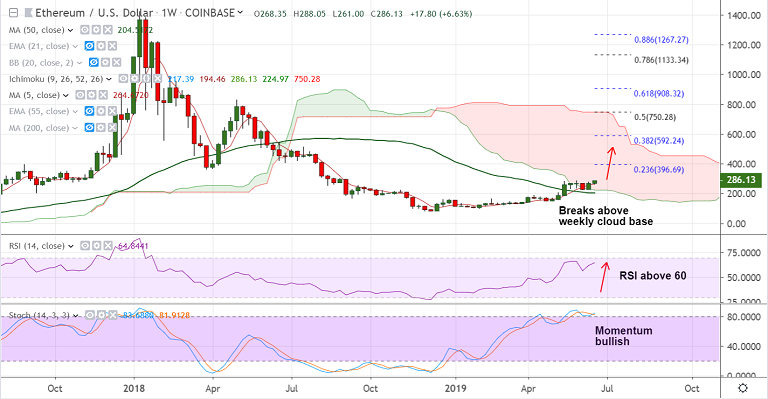
ETH/USD chart - Trading View
Exchange - Coinbase
Support: 273.34 (5-DMA); Resistance: 288.77 (2019 high)
Technical Analysis: Bias Bullish
ETH/USD spikes over 5% on the day to re-test 2019 highs at 288 level.
The pair ends consolidation and is set to extend upside, tracking Bitcoin prices.
Momentum studies are highly bullish. MACD and ADX support upside continuation.
On the weekly charts, the pair has broken above 55W EMA resistance and entered into cloud.
Volatility is rising as indicated by widening Bollinger Bands rising scope for new highs.
Next bull target would be $350 ahead of 396 (23.6% Fib retracement).
Failure to hold above weekly cloud base will see resumption of downside.
For details on FxWirePro's Currency Strength Index, visit http://www.fxwirepro.com/currencyindex.