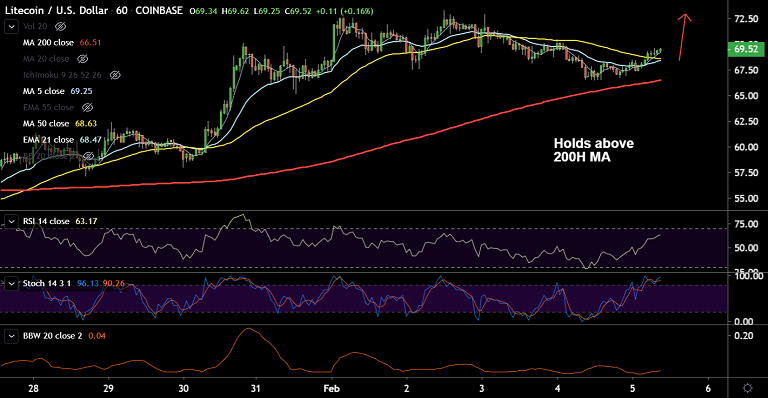
LTC/USD chart - Trading View
Exchange - Coinbase
Technical Analysis: Bias Slightly Bullish
Support: 66.51 (200H MA); Resistance: 77.95 (38.2% Fib)
LTC/USD was trading 2.76% higher on the day at 69.71 at 09:45 GMT, after closing 2.46% lower in the previous session.
The pair has halted 3 straight sessions of downside and the correction has held above 200H MA.
Major and minor trend according to the GMMA indicator are bullish and decisive break above 5-DMA will see upside continuation.
Technical indicators are biased higher. Next major hurdle on the upside lies at 38.2% Fib at 77.95.
200H MA is immediate support at 66.51. Break below 200-DMA (61.15) negates near-term upside.



FxWirePro: GBP/USD recovers some ground but bears are not done yet
Ethereum Tumbles Below $2K: Bears Eye $1,700 as All Key EMAs Flip Red
FxWirePro- Major Pair levels and bias summary
Bitcoin Cracks $75K as $1.3B ETF Exodus and Middle East Jitters Spook Bulls; Bears Eye $70K
FxWirePro- Major Crypto levels and bias summary
FxWirePro: USD/CNY bears maintain upper hand
ETH Cracks $2,100 in Bitcoin’s Wake as Bearish EMA Stack Deepens; Sellers Target $1,900 on Rallies
FxWirePro: NZD/USD gains as hawkish RBNZ comments boost Kiwi dollar
FxWirePro: EUR/ NZD dips below lower range, bearish bias increases
FxWirePro- Major Crypto levels and bias summary
Bitcoin Buckles at $73,500: Middle East Tensions and Weak Institutional Demand Set Bearish EMA Stack on $70K Collision Course 


