


 GBPJPY Bullish on Consolidation: Holds Above 216 After 218 Top – Buy Dips at 217 Targeting 220
  FxWirePro :USD/JPY bulls loosen their grip a bit, dips to be bought
  FxWirePro: NZD/USD steadies around 0.5830,retains bid tone
  FxWirePro- Major Pair levels and bias summary
  FxWirePro- Major Crypto levels and bias summary
  FxWirePro- Major Crypto levels and bias summary
  ETHUSD Bullish Momentum: Follows BTC Above All EMAs, Buy Dips Near $1750 Targeting $2300
  FxWirePro: AUD/USD edges lower, but bullish outlook persists
  Gold Loses Steam After Strong U.S. Retail Sales


, further weakness on break below - EconoTimes)


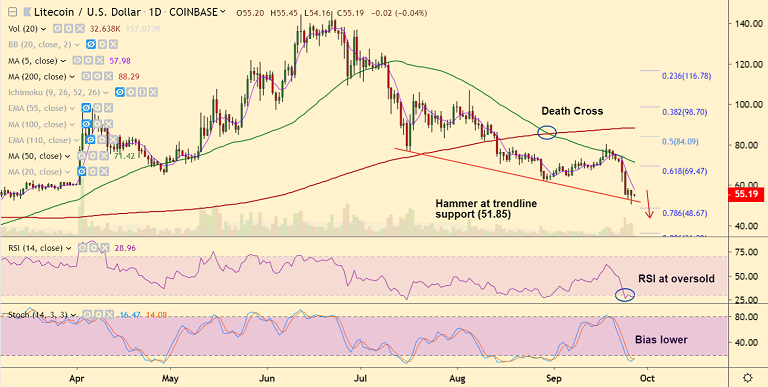
LTC/USD chart - Trading View
Exchange - Coinbase
Support: 51.85 (Trendline); Resistance: 57.91 (5-DMA)
Technical Analysis: Bias Bearish
Litecoin trades in narrow range, was trading 0.69% lower on the day at 54.83 at 07:00 GMT.
The pair hit 6-month lows at 50.25 on Thursday's trade, before paring losses to close at 55.21.
Major trend is bearish, recovery attempts lack traction. 'Death Cross' limits upside.
On the other side, oscillators are at oversold levels and 'hammer' formation on the daily charts (Thursday) raises scope for upside.
Bullish divergence (RSI and Stochs) on the hourly charts has pushed price above 21H EMA.
Next hurdle lies at 5-DMA at 58.01. Break above will see further upside. On the other side, break below trendline support (51.85) will see resumption of weakness.


