


 FxWirePro: GBP/USD hits one-month high, scope for further upside
  FxWirePro: USD/ZAR advances as South African rand weakens amid renewed Middle East tensions
  FxWirePro- Major Crypto levels and bias summary
  JPY Action Bias: Extremely Bullish Surge Ignites Across NZD, GBP & AUD
  Major Pair Action Bias: Extremely Bullish Surge Powers GBPUSD & NZDUSD as Bullish Momentum Ignites
  FxWirePro:EUR/NZD dips below lower range, bearish bias increases
  FxWirePro: AUD/USD edges lower, but bullish outlook persists
  FxWirePro: USD/CAD falls after BoC rate hold and weak U.S. producer inflation
  FxWirePro- Major Crypto levels and bias summary
  JPY Action Bias: CADJPY Turns Extremely Bullish While Other Pairs Hold Positive Ground
  Crypto Major Pair Action Bias: ETHUSD Bullish as BTCUSD, SOLUSD & XRPUSD Stay Neutral


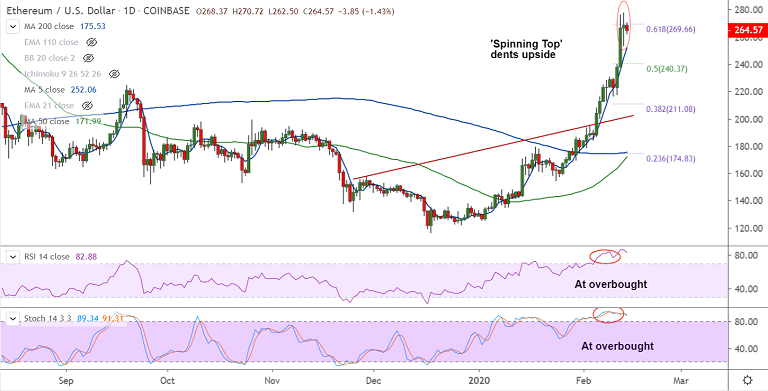
ETH/USD chart - Trading View
Exchange - Coinbase
Technical Analysis: Bias Bullish
GMMA Indicator: Major Trend - Bullish; Minor Trend - Bullish
Overbought/ Oversold Index: Overbought
Volatility: High and Rising
Support: 251.83 (5-DMA); Resistance: 269.66 (61.8% Fib)
ETH/USD was trading 1.86% lower on the day at 263.42 at around 06:10 GMT, after closing largely unchanged in the previous session.
The pair has formed a 'Spinning Top' on the previous day's candle, denting upside momentum.
Technical bias remains bullish and we see resumption of upside momentum. That said, overbought oscillators could see more correction before the next leg higher.
Price action hovers around 61.8% Fib at 269.66 and finds immediate support at 5-DMA at 251.83.
Break below 5-DMA will see test of 200H MA at 232.86. Violation there could see more weakness.
Resumption of upside will see test of 300 levels. Bullish invalidation only below 200-DMA.


