


 GBPJPY Bullish Surge: Strong Pound Ignites Fresh Upside on Fed-BOE Policy Divergence as All EMAs Align
  FxWirePro: GBP/USD under pressure despite UK's modest economic growth
  Crypto Major Pair Action Bias: ETHUSD Bullish as BTCUSD, SOLUSD & XRPUSD Stay Neutral
  Gold Loses Steam After Strong U.S. Retail Sales
  FxWirePro: EUR/AUD outlook weaker on renewed downside pressure
  FxWirePro:EUR/NZD dips below lower range, bearish bias increases
  FxWirePro: GBP/NZD gains some upside momentum but still bearish
  FxWirePro- Major Crypto levels and bias summary
  FxWirePro- Major Pair levels and bias summary


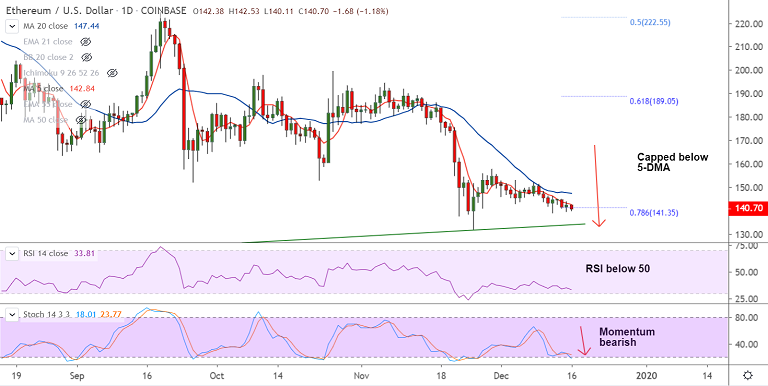
ETH/USD chart - Trading View
Exchange - Coinbase
Support: 133.50 (Trendline); Resistance: 142.84 (5-DMA)
Technical Analysis: Bias Bearish
ETH/USD is extending weakness on the day, bears largely ignore 'Spinning Top' formation on the previous day's candle.
The pair was trading 1.05% lower at 140.88 at 08:50 GMT, after closing 0.46% higher in the previous session.
Upside remains capped at 5-DMA, technical indicators are biased lower, momentum with the bears.
Stochs are sharply lower, RSI is well below 50 mark. MACD in deep negative territory adds to the bearish bias.
Bearish technical indicators with rising volatility to plummet prices. Dip till trendline support at 133.50 likely.
Stiff resistance lies at at 200H MA at 145. Break above will see a shift near-term dynamics.


