


 FxWirePro- Major Crypto levels and bias summary
  FxWirePro- Major Crypto levels and bias summary
  FxWirePro- Major Crypto levels and bias summary


 Add as a preferred source on Google
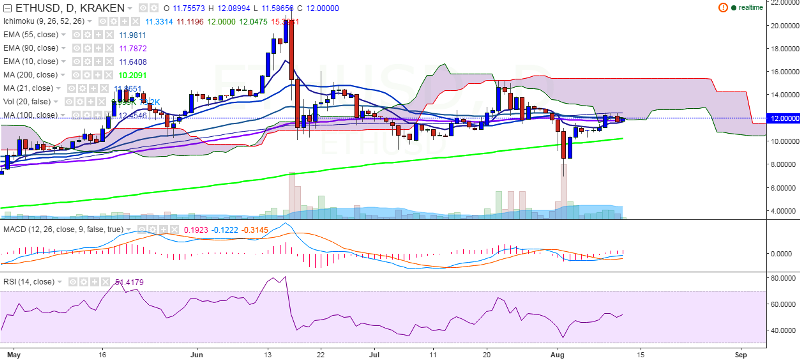
ETH/USD seems to be trying to sustain its strength above 90 EMA. It has partially recovered losses on Friday and is currently trading at 12.00 levels (Kraken).
Long-term trend: bullish
Ichimoku analysis of daily chart:
Tenkan Sen: 10.50
Kijun Sen: 11.11
Trend reversal: 11.78 (90 EMA)
On the topside, major resistance is seen at 12.42 (100-day MA) and a break above would see the pair reaching 13.47 (78.6% retracement of 15.2392 and 7)/ 15.2392 (July 22 high).
On the reverse side, the pair seems to have taken support near 10 EMA. Further down, it will find support at 10.16 (200-day MA) and a break below would target 9.09 (61.8% retracement of 7 and 12.4795)/7.00 (August 2 low).

- News

- Economy

- Central Banks
- Investing
- Research
- Roundups
- Digital Currency
- Insights
- Technical Analysis
- Technology
- Business
- Law
- Health
- Nature
- Fintech
- Science
- Topic
- Opinions
- ©Econometrics LLC . All Rights Reserved.
ETH/USD faces resistance at 100-day MA, break above targets 15.32
Friday, August 12, 2016 9:58 AM UTC
Editor's Picks



- Market Data
Most Popular




