


 Nikkei Surges Past 65,000 on Suspected Yen Weakness: Tech Giants Like Advantest and NEC Lead Explosive Gains
  FxWirePro- Major Pair levels and bias summary
  FxWirePro- Major Crypto levels and bias summary
  FxWirePro- Woodies pivot (Major)
  FxWirePro- Major Pair levels and bias summary
  FxWirePro: EUR/ AUD dips below 1.6400 level, focus on near term support
  All Major JPY Pairs Hit Extreme Bearish Score of -100: USDJPY, EURJPY, GBPJPY, AUDJPY, NZDJPY & CADJPY Flash Maximum Weakness
  FxWirePro:USD/JPY climbs back above 160.00 after BOJ rate decision
  FxWirePro: GBP/USD rises as soft US data pressures dollar
  FxWirePro: USD/CAD retreats after Canada posts stronger-than-expected GDP growth
  FxWirePro: GBP/NZD remains weak, eyes 38.2%fib support
  US Magnificent 7 Stocks Trend Score: Amazon & Microsoft Hit Extreme Bullish (+100) as Meta Drops to -100 — Key Resistance & Support Watchlist
  FxWirePro: GBP/NZD remains weak, eyes 38.2%fib support
  FxWirePro: AUD/USD gains some ground but outlook is bearish
  NZDJPY Retreats on Yen Strength – Bearish Setup Targets 90 After Hitting 92.75 Low
  AUDJPY Volatile After Massive Sell-Off: Sell Rallies at 113, Targeting 110 as Bearish Momentum Surges


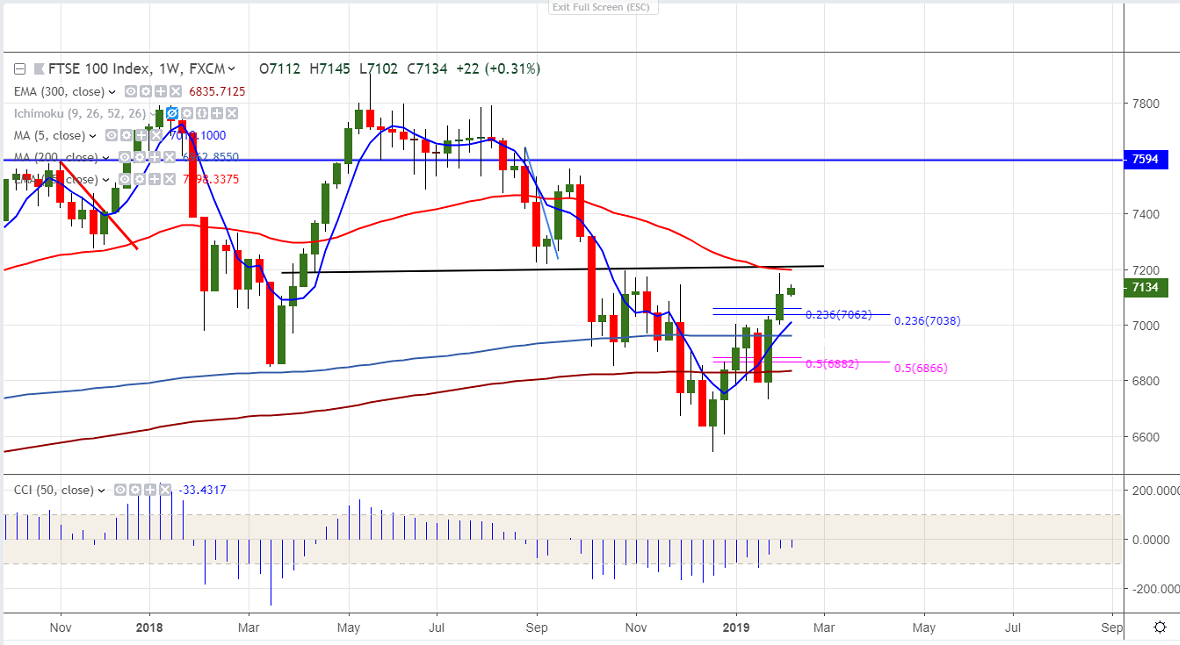
Chart pattern - Double top
FTSE100 has once again declined after a jump till 7188 level. The index has formed a minor bottom around 6532 and jumped nearly 10% on account of jump in global market and weak pound sterling.
The index has taken support near 23.6% fib around 7062 and shown a minor jump. Any weakness in the near term cane seen if FTSE100 trades below 7038 and any violation below targets 6962 (200 W MA). Any close below 6960 confirms further weakness and a dip till 6900/6833.Major bearish continuation only below 6733 level.
On the higher side near term resistance is around 7200-7220 any break above confirms bullish continuation and a jump till 7300/7560 is possible.
It is good to buy on dips around 7065-70 with SL around 7000 for the TP of 7200/7300.


