


 U.S. Stocks vs. Bonds: Are Diverging Valuations Signaling a Shift?
  UBS Boosts China Tech Bets, Adds Kuaishou and Meituan to Focus List
  China's Refining Industry Faces Major Shakeup Amid Challenges
  Moldova Criticizes Russia Amid Transdniestria Energy Crisis
  Trump’s "Shock and Awe" Agenda: Executive Orders from Day One
  Gold Pulls Back After Hitting $4,180 as Geopolitical Risk Sends Crude Higher
  China’s Growth Faces Structural Challenges Amid Doubts Over Data
  Moody's Upgrades Argentina's Credit Rating Amid Economic Reforms
  Urban studies: Doing research when every city is different
  Indonesia Surprises Markets with Interest Rate Cut Amid Currency Pressure


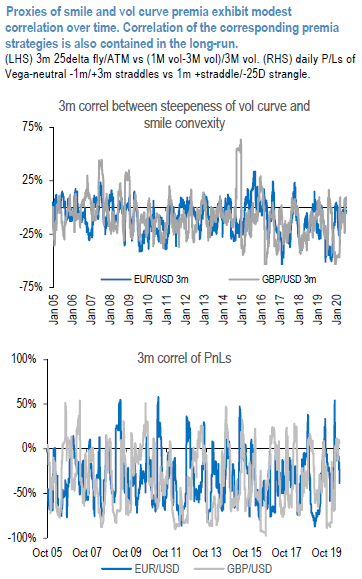
We investigate the correlation between smile and term structure dynamics for FX vol surfaces, in order to assess the possible diversification benefit offered by these “hybrid” smile/curve strategies. During risk-off times, one could intuitively expect curves to invert and smiles becoming more convex, thus triggering a positive correlation between the two strategies and a doubling-up of risk when mixing them together. We start by computing the rolling correlation of ex-ante proxies of smile (3m 25-delta fly/ATM) and curve premia ((1M vol-3M vol)/3M vol), for EURUSD and GBPUSD (upper chart of 1st exhibit). For both cases considered, the correlation of proxy premia is not significant over time. The ex-post measure, based on the daily PnLs of JP Morgan’s actual strategies (lower chart of 1st exhibit - Vega-neutral -1m/+3m straddles and 1m +straddle/-25-delta strangle), similarly does not highlight a structurally positive correlation, confirming the added value of combining the two risk premia together.
We then investigate actual back-tests for strangle/straddle calendar strategies. We start from the term structure benchmark and twist the short vol leg from straddle to strangle. We wouldn’t address the topic of different Vega scaling in one go, which seemed important for managing the impact of costs in the earlier note on smile strategies – for this purpose, we assume zero costs to start with and we’ll dig more on costs / relative scaling of Vega notionals in future publications. Backtests refer to 15-yr periods (except for USDCNH, since January 2011), implementations are in a Vega-neutral short 25-delta strangle/ long straddle with -1m/+3m and -3m+1y tenors.
We start by presenting results for USD/G10 pairs (refer 2nd chart). In the charts, we display Sharpe ratios for three cases: a) short front-end straddle; b) straddle vs. straddle calendar
steepener; c) short strangle vs. long straddle calendar steepener. As discussed, under the strong assumption of zero trading costs, results are very appealing, in that calendars typically outperform plain short-Gamma in terms of higher Sharpe ratios, and so do the smile-twisted calendars over the straddle vs. straddle ones. Under the zero-cost limit, playing very much at the front of the curves outperforms longer-tenor trades (although the impact of costs might prove more onerous). Also, when taking into account costs, the Vega-neutrality constraint might prove too tight, and possibly realistic implementations would require relaxing the condition in favor of more aggressive Theta-harvesting structures. With these caveats in mind, EURUSD and USDJPY are the two cases associated with more promising output. One thing to keep in mind is that currently depressed Sharpe ratios come on the heels of the dramatic March vol episode that slammed the recent short vol performance. The bulk of the USD pairs is still undergoing the recovery. Results for USDCHF suffer from the January 2015 de-pegging by SNB, which severely impacted short-Gamma trades. Courtesy: JPM


