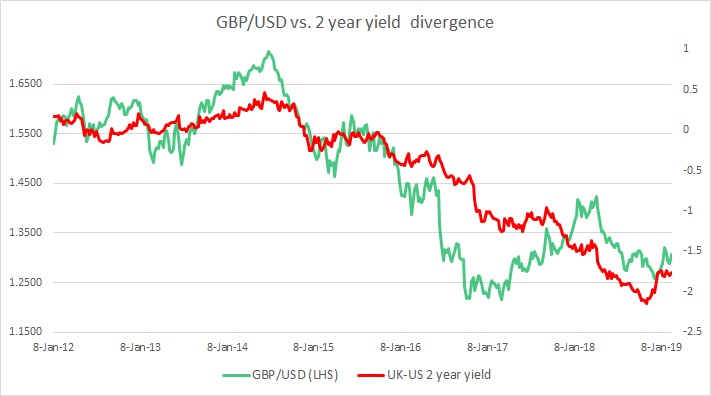
The chart above shows, how the relationship between GBP/USD and 2-year yield divergence has unfolded since 2012.
The chart clearly shows the close relationship between the yield spread and the exchange rate. Since June 2014, the yield spread declined from 0.5 percent area to -2.15 percent area by November 2018, and GBP/USD declined from 1.71 to 1.25 area.
In our December review, we noted that since the second week of November, the yield spread has reversed course, and rose from -2.15 percent to -1.9 percent, which suggested there might be a reversal in the exchange rate going ahead, should the spread continue its reversal.
As expected, the exchange rate has reversed course and currently trading around 1.308 area. However, as the spread is broadly unchanged in February at -176 bps, the pound is continuing its consolidation.