


 Goldman Predicts 50% Odds of 10% U.S. Tariff on Copper by Q1 Close
  FxWirePro: AUD/USD drifts lower, uninspired by jobs beat
  FxWirePro- Major Pair levels and bias summary
  European Stocks Rally on Chinese Growth and Mining Merger Speculation
  FxWirePro: USD/JPY edges higher as the yen remains vulnerable despite repeated warnings of intervention.
  BTC Slips Below $60K as Institutional Demand Dries Up — Bears Eye $59K Support, Rallies to $63K for Shorts
  UBS Projects Mixed Market Outlook for 2025 Amid Trump Policy Uncertainty
  U.S. Stocks vs. Bonds: Are Diverging Valuations Signaling a Shift?
  Trump’s "Shock and Awe" Agenda: Executive Orders from Day One
  Wall Street Analysts Weigh in on Latest NFP Data
  Energy Sector Outlook 2025: AI's Role and Market Dynamics
  S&P 500 Relies on Tech for Growth in Q4 2024, Says Barclays
  FxWirePro- Major Crypto levels and bias summary
  Fed May Resume Rate Hikes: BofA Analysts Outline Key Scenarios
  Moldova Criticizes Russia Amid Transdniestria Energy Crisis
  US Futures Rise as Investors Eye Earnings, Inflation Data, and Wildfire Impacts
  FxWirePro: GBP/USD slides toward critical support market reassesses UK political transition


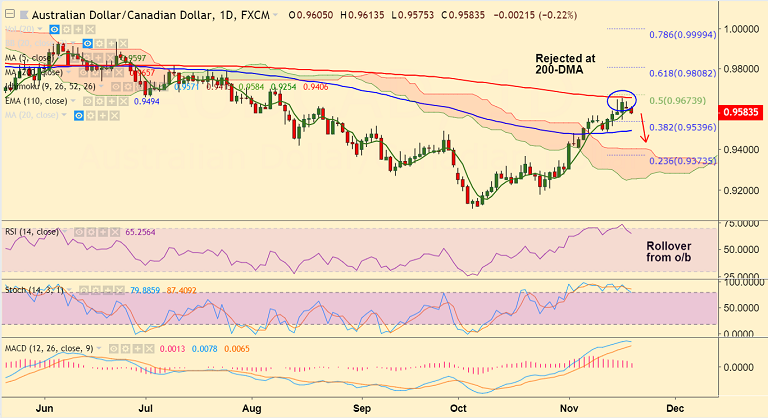
AUD/CAD chart on Trading View used for analysis
- AUD/CAD is extending downside for the sencond straight session, bias lower.
- The pair has been rejected at 200-DMA and we see any upside only on decisivebreak above.
- Risk-off action on the Asian equities and a non-eventful RBA minutes keep the Aussie on the back-foot.
- Technical indicators are turning bearish. Stochs and RSI are on verge of roll over from overbought levels.
- We see bearish divergence on Stochastics on daily charts which raises scope for downside.
- Dip till 110-EMA at 0.9494 likely. Further weakness only on break below.
Support levels - 0.9540 (38.2% Fib), 0.9494 (110-EMA), 0.9406 (cloud top)
Resistance levels - 0.9598 (5-DMA), 0.9657 (200-DMA), 0.9674 (50% Fib)
For details on FxWirePro's Currency Strength Index, visit http://www.fxwirepro.com/currencyindex.


