


 AUDJPY Extends Four-Day Rally on Yen Weakness: Bullish Dip-Buy Eyes 117-118
  FxWirePro: GBP/NZD gains some ground but outlook is bearish
  FxWirePro- Woodies pivot (Major)
  FxWirePro: GBP/AUD bears maintain upper hand
  FxWirePro: AUD/USD uptrend loses steam, remains on bearish path
  FxWirePro- Major Pair levels and bias summary
  BTC, ETH, SOL, XRP, and BNB: Major Crypto Pairs Stay Neutral
  FxWirePro: USD/ZAR retreats slightly but bias is bullish
  NZDJPY Bullish Dip-Buy Setup: 93.60 Support Unlocks Path to 97
  FxWirePro: USD/CAD edges lower but bullish outlook persists
  FxWirePro: EUR/NZD firms after ECB holds rates steady at 2.25%
  FxWirePro: AUD/USD gains on Iran-US truce hopes, risk rally
  FxWirePro: GBP/NZD downside pressure builds, key support levels in focus
  FxWirePro- Major Crypto levels and bias summary
  FxWirePro- Major Crypto levels and bias summary
  JPY Action Bias: USDJPY, EURJPY, and CADJPY Emerge as Top Extremely Bullish Picks


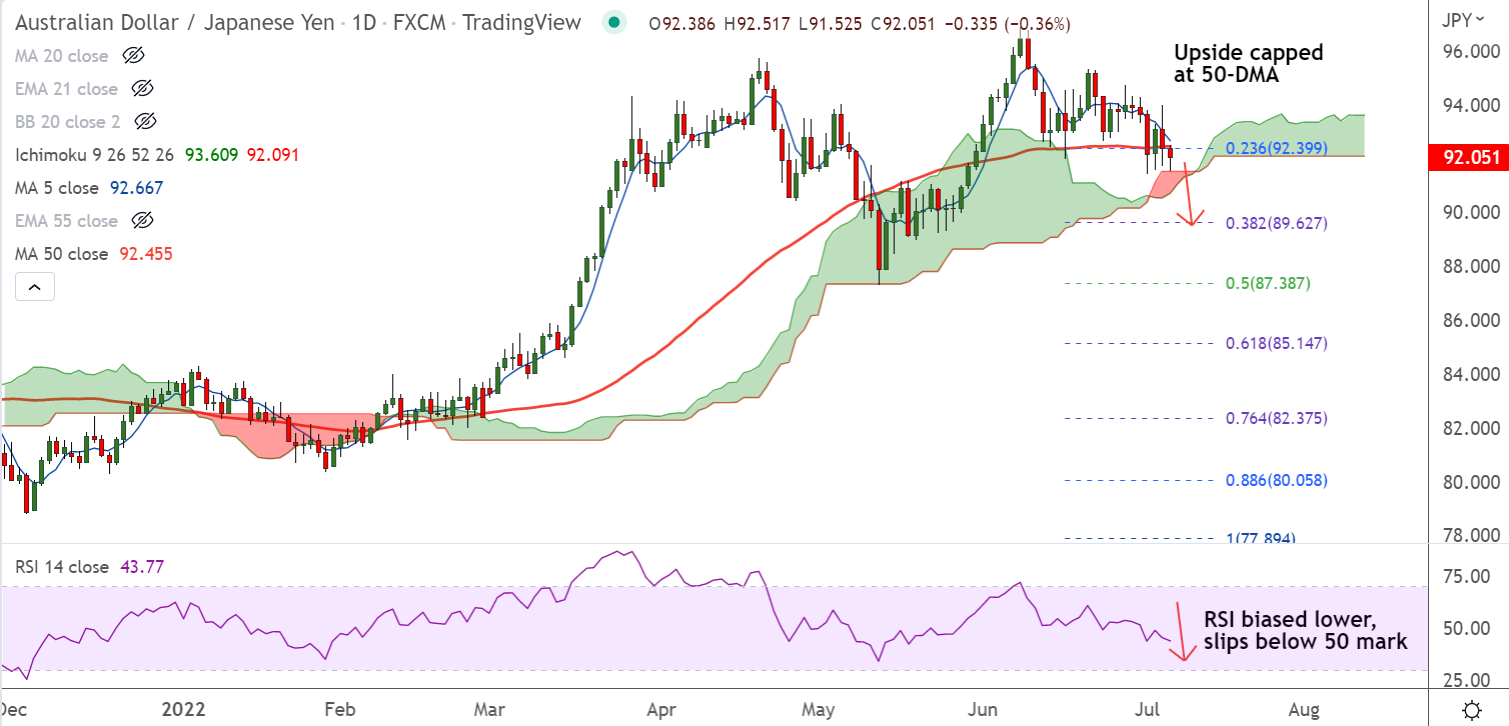
Chart - Courtesy Trading View
Technical Analysis:
- AUD/JPY was trading 0.28% lower on the day at 92.13 at around 12:50 GMT
- The pair is extending weakness from multi-year highs at 96.88 hit last week
- Downside has held support at daily cloud, break below will drag the pair lower
- Momentum is bearish, Stochs and RSI are biased lower, RSI is below 50 mark
- Price action is below 200H MA and GMMA indicator has turned bearish on the intraday charts
Support levels - 90.99 (20-week MA), 90.34 (110-EMA)
Resistance levels - 92.35 (55-EMA), 93.22 (21-EMA)
Summary: AUD/JPY bias remains bearish as long as pair holds below 55-EMA. Technical indicators are bearish. Scope for test of 110-EMA at 90.34.


