


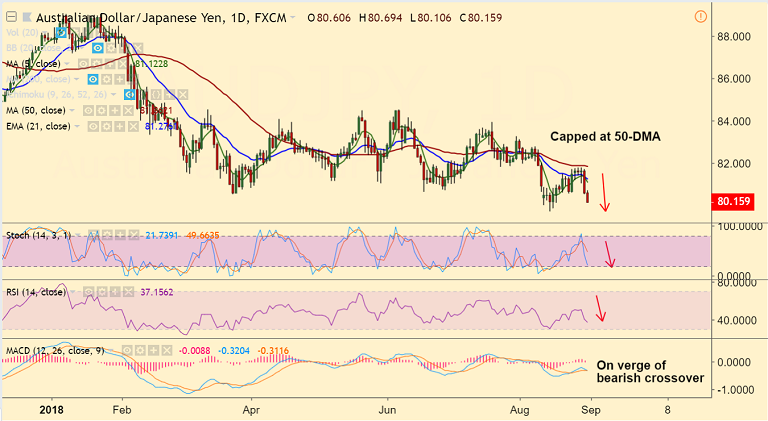
AUD/JPY chart on Trading View used for analysis
- AUD/JPY is extending downside after failing to break above 50-DMA resistance.
- Aussie extend dismal CAPEX reading led losses, largely ignores upbeat China official PMI data.
- Data released earlier today showed China official manufacturing PMI for August printed at 51.3 and the non-manufacturing PMI came in at 54.2, beating forecasts at 51 and 53.8 respectively.
- That said, escalating US-China trade war could cap any recovery attempts in the pair.
- Technical indicators on daily charts are turning bearish. Stochs and RSI have turned lower and MACD is on verge of bearish crossover on signal line.
- AUD/JPY is holding above 80 mark, break below will drag the pair lower. Test of 61.8% Fib at 79.26 then likely.
- On the flipside, 50-DMA is major resistance, we see upside only on break above.
Support levels - 79.70 (Aug 15 low), 79.26 (61.8% Fib), 79
Resistance levels - 81.11 (5-DMA), 81.27 (21-EMA), 81.86 (50-DMA)
Recommendation: Stay short on upticks, SL: 81.30, TP: 79.70/ 79.25
FxWirePro Currency Strength Index: FxWirePro's Hourly AUD Spot Index was at -103.631 (Bearish), while Hourly JPY Spot Index was at 32.3012 (Neutral) at 1015 GMT. For more details on FxWirePro's Currency Strength Index, visit http://www.fxwirepro.com/currencyindex.


