


 FxWirePro: AUD/USD falls after softer-than-expected Australian Q2 CPI
  FxWirePro: GBP/AUD downside pressure builds, key support level in focus
  FxWirePro: USD/ CNY remains soft ahead of Fed decision
  AUDJPY Weakness Deepens: Sell Rallies Toward 112 as Aussie Dollar Falters
  JPY Pairs Action Bias: EURJPY Leads as Bullish Standout Amid Mixed Momentum
  FxWirePro: NZD/USD edges lower, remains on back foot
  FxWirePro: EUR/AUD outlook weaker on renewed downside pressure
  JPY Action Bias: USDJPY Emerges as the Clear Bullish Pair to Watch Amid Mixed Crosses
  EUR/JPY Holds Bullish Bias as Euro Extends Recovery
  NZDJPY Pullback: Sell Rallies Toward 93.30 as Yen Weakness Eases
  NZD/JPY Flatlines Near 94.60: Will Key Support Reignite the Uptrend?
  FxWirePro- Woodies pivot (Major)
  FxWirePro: GBP/USD edges higher as traders await BoE guidance and UK fiscal clarity
  FxWirePro- Major Pair levels and bias summary
  FxWirePro : USD/JPY holds relatively bid on 163 ahead Of FOMC,BoJ meetings
  FxWirePro: NZD/USD neutral in the near-term, scope for downward resumption


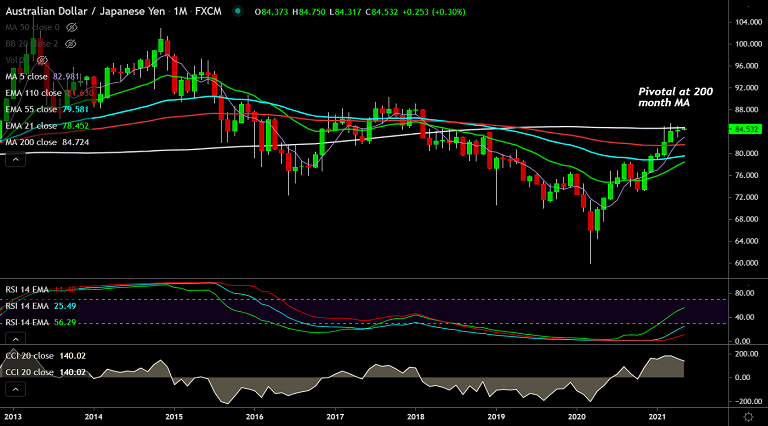
AUD/JPY chart - Trading View
Spot Analysis:
AUD/JPY was trading 0.14% lower on the day at 84.48 at around 07:35 GMT
Previous Day's High/Low: 84.75/ 84.31
Previous Week's High/Low: 85.00/ 83.50
Fundamental Overview:
The Australian dollar was left depressed after RBA inaction and Australian Trade Surplus missed expectations in March.
The Reserve Bank of Australia (RBA) keeps its Cash Rate unchanged at 0.10% while also reiterating the 3-year bond yield target as 0.10%.
On the data front, Australia’s headline Trade Balance for March dropped below 7529M prior and 8000M market consensus to 5574M.
Details of the report showed that the Imports eased from 5.0% to 4.0% while Exports came in at -2.0% against -1.0% previous reading.
Earlier in the day, Aussie weekly consumer sentiment improved from 112.4 to 112.7. Home Loans and Investment Lending for Homes also came in strong.
Technical Analysis:
- The pair is struggling to break above 200-month MA
- Volatility is high as evidenced by widening Bollinger bands
- GMMA indicator shows major and minor trend are bullish
- Price action is above major moving averages and pullback has held cloud support
- After consolidating around 76.4% Fib, the pair is set to resume upside
Major Support and Resistance Levels:
Support - 84.50 (5-DMA), 84.05 (21-EMA), 83.29 (55-EMA)
Resistance - 84.72 (200-month MA), 85.44 (Yearly high), 86.83 (88.6% Fib)
Summary: Technical indicators are supportive of upside in the pair. Watch out for breakout at 200-month MA for upside resumption. Next major bull target lies at 88.6% Fib at 86.83.


