


 FxWirePro: NZD/USD jumps after US and Iran agree preliminary deal
  Peace Dividend Powers NZDJPY Past 93.50 — Bulls Set Sights on 96.15 Target
  Relief Rally Extends to 112.75, but AUDJPY EMA Structure Favors Selling
  Sell the Bounce: NZDJPY Bearish Bias Persists Below 94.20, Eyes 90.50
  FxWirePro: EUR/AUD loses upside momentum but outlook is bullish
  FxWirePro: USD/JPY gains above 160 level ahead of BOJ policy meeting
  FxWirePro- Major Pair levels and bias summary
  GBPJPY Coil Tightens: Is a Bullish Break Above 215.60 Imminent?
  BTC’s Bear Bounce: Sell the Rally Near $66K as Bears Target $59K–$52K Breakdown
  FxWirePro: EUR/ NZD uptrend loses steam, remains on bullish path
  Geopolitical Easing Fuels AUDJPY Rally Toward 115 — Buy Dips at 113
  FxWirePro: USD/ CNY falls towards 6.750, bears keep the advantage
  Ethereum Cracks Under $1,700: Sell the Rally Near $1,750 as Bears Eye $1,380–$1,200


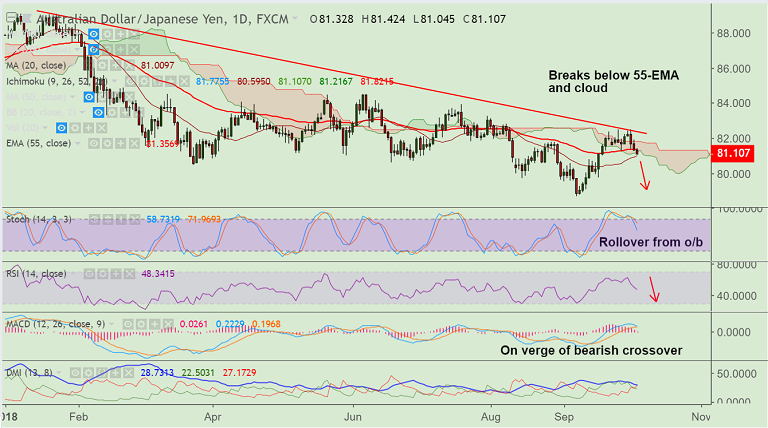
AUD/JPY chart on Trading View used for analysis
- AUD/JPY edges lower despite upbeat Australia Trade Balance data.
- Australia's Trade Balance printed at 1.6 billion early Thursday, beating the 1.4 billion forecast and compared to the previous reading of 1.551 billion.
- However, Australia's Imports continued to show no growth, holding steady at the 0% figure. Exports managed to reverse the previous period's -1% contraction, coming in at 1%.
- The pair is extending weakness for the 3rd straight session, slips below 55-EMA and daily cloud support.
- Technical indicators are turning bearish. Stochs have rolled over from overbought levels and RSI has turned south.
- MACD is on verge of a bearish crossover on signal line which if completed will add to the bearish bias.
- We see strong support at 81 mark (psychological level and 20-DMA). Break below to see further weakness.
Support levels - 81 (20-DMA), 80.62 (June 19 low), 79.70 (Aug 15 low)
Resistance levels - 81.67 (5-DMA), 81.90 (110-EMA), 82
Recommendation: Good to go short on break below 20-DMA, SL: 61.70, TP: 80.65/ 80/ 79.70
FxWirePro Currency Strength Index: FxWirePro's Hourly AUD Spot Index was at -181.304 (Bearish), while Hourly JPY Spot Index was at 86.9489 (Bullish) at 0415 GMT.
For more details on FxWirePro's Currency Strength Index, visit http://www.fxwirepro.com/currencyindex.


