


 FxWirePro- Woodies pivot (Major)
  FxWirePro: GBP/NZD gains some ground but outlook is bearish
  FxWirePro- Major Crypto levels and bias summary
  AUDJPY Extends Four-Day Rally on Yen Weakness: Bullish Dip-Buy Eyes 117-118
  FxWirePro- Major Pair levels and bias summary
  FxWirePro: GBP/AUD bears maintain upper hand
  FxWirePro- Woodies pivot (Major)
  FxWirePro: GBP/USD slips as middle east tensions and oil surge pressure pound
  FxWirePro: USD/CAD positions for another climb, eyes 1.4150 level
  FxWirePro: GBP/AUD under pressure as pound continues to weaken
  FxWirePro: EUR/NZD firms after ECB holds rates steady at 2.25%
  EUR/USD Slides After ECB Hold, Bearish Technicals Favor Rally Fades
  Crypto Bias Report: Trend Signals and Top Bullish Picks
  FxWirePro: USD/CNY edges higher but bulls lack punch
  FxWirePro- Major Crypto levels and bias summary


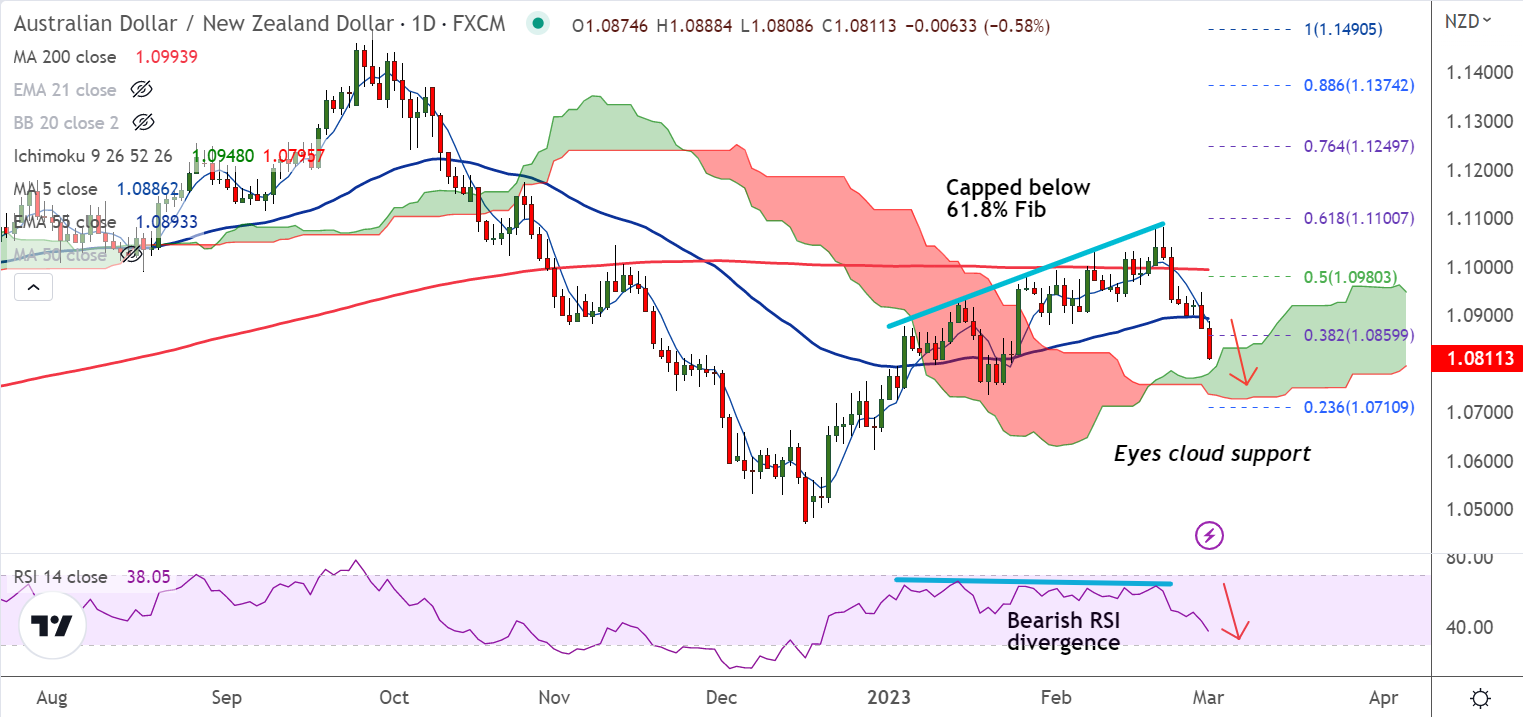
Chart - Courtesy Trading View
Technical Analysis:
- AUD/NZD slumped nearly 0.60% on the day to trade at 1.0810 at around 10:30 GMT
- Bearish RSI divergence to drive further weakness in the pair along with bearish momentum and rising volatility
- MACD and ADX support further downside in the pair, Chikou span is biased lower
- Price action is extending weakness after rejection at 200-DMA, GMMA indicator shows minor trend is turning bearish
- Daily cloud offers strong support, further weakness only on break below
Support levels:
S1: 1.0779 (Cloud top)
S2: 1.0698 (200-week MA)
Resistance levels:
R1: 1.0886 (5-DMA)
R2: 1.0893 (55-EMA)
Summary: AUD/NZD trades with a bearish bias. Scope for test of daily cloud support at 1.0779. Further weakness on break below.


