Home / Technicals / Article Technicals / Research & Analysis
Add as a preferred source on Google FxWirePro: AUD/NZD Near-Term Outlook AUD/NZD chart on Trading View used for analysis AUD/NZD has been trading in a "Symmetric Triangle" pattern, bias remains bearish. The pair is testing 'Triangle Base' support at 1.06 and break below will see weakness. We …
By FxWirePro Team Dec 4, 2018, 8:19 AM UTC
Image from the original EconoTimes article Read the original article
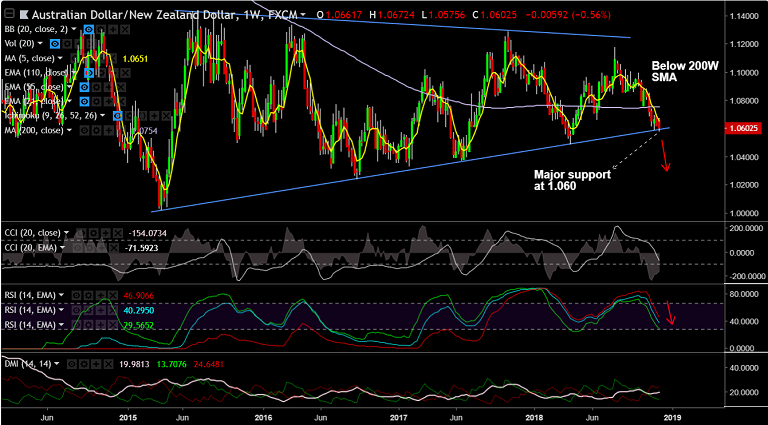
AUD/NZD chart on Trading View used for analysis
AUD/NZD has been trading in a "Symmetric Triangle" pattern, bias remains bearish.
The pair is testing 'Triangle Base' support at 1.06 and break below will see weakness.
We see little support till 1.0488 (Apr 2018 low). Further weakness can drag the pair till 1.0370 (Jun 2017 low).
Technical indicators on weekly charts are bearish. Stochs and RSI sharply lower.
MACD supports downside. We see -ve DMI dominance and ADX rising in support of weakness.
Price has slipped below weekly cloud and 200 SMA and we see bearish invalidation only on retrace above 200W SMA.
Support levels - 1.06 (Triangle base), 1.0488 (Apr 2018 low), 1.0370 (Jun 2017 low)Resistance levels - 1.0630 (5-DMA), 1.0754 (200-W SMA)Recommendation : Watch out for breach at Triangle base for weakness, target 1.0490For details on FxWirePro's Currency Strength Index, visit http://www.fxwirepro.com/currencyindex .
Technicals EURUSD - Levels to watch - 1.1100 GBPUSD Levels to watch - 1.3180 USDCHF Levels to watch - 0.8365 USDCAD - Levels to watch - 1.4300 AUDUSD - Levels to watch - 0.7000 NZDUSD - Levels to watch - 0.5560
By FxWirePro Team Oct 15, 2026, 3:20 AM UTC
Technicals EURUSD - Levels to watch - 1.100 GBPUSD Levels to watch - 1.3180 USDCHF Levels to watch - 0.8400 USDCAD - Levels to watch - 1.4300 AUDUSD - Levels to watch - 0.7000 NZDUSD - Levels to watch - 0.5560
By FxWirePro Team Oct 15, 2026, 3:17 AM UTC
Technicals JPY Major Pair Currency Score: USDJPY, GBPJPY and AUDJPY Extremely Bearish
By FxWirePro Team Oct 15, 2026, 2:34 AM UTC