


 FxWirePro : USD/JPY holds relatively bid on 163 ahead Of FOMC,BoJ meetings
  FxWirePro: USD/ZAR retreats but trend is still bullish
  FxWirePro: GBP/NZD maintains bersish bias with focus on 2.2900 level
  FxWirePro: AUD/USD dips after RBA Governor speech
  NZDJPY Pullback: Sell Rallies Toward 93.30 as Yen Weakness Eases
  FxWirePro: GBP/USD edges higher as traders await BoE guidance and UK fiscal clarity
  JPY Pairs Action Bias: EURJPY Leads as Bullish Standout Amid Mixed Momentum
  NZD/JPY Flatlines Near 94.60: Will Key Support Reignite the Uptrend?
  JPY Action Bias: USDJPY Emerges as the Clear Bullish Pair to Watch Amid Mixed Crosses
  FxWirePro: GBP/AUD gains some upside momentum but still bearish
  FxWirePro: AUD/USD falls after softer-than-expected Australian Q2 CPI
  FxWirePro: NZD/USD neutral in the near-term, scope for downward resumption
  EUR/JPY Holds Bullish Bias as Euro Extends Recovery
  Major Pairs Action Bias: USDCAD and USDCHF Stand Out as Extremely Bullish While GBPUSD and NZDUSD Turn Extremely Bearish
  EUR/USD Bounces from Monthly Low, But Bearish Pressure Remains
  FxWirePro: USD/JPY eases ahead of Fed decision , Intervention risks linger


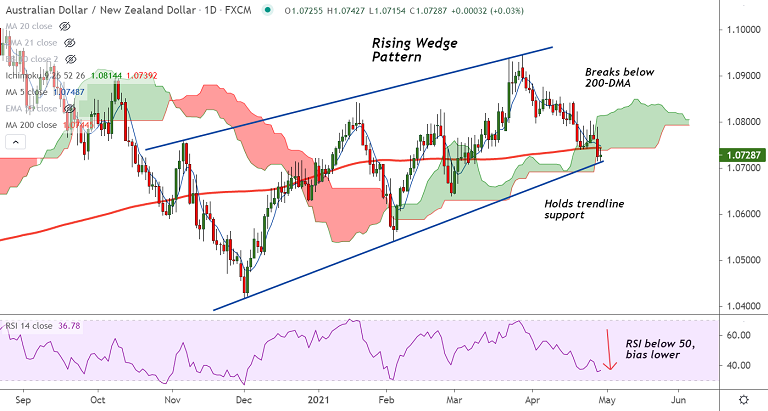
AUD/NZD chart - Trading View
Technical Analysis: Bias Bearish
- AUD/NZD consolidates break below 200-DMA, outlook bearish
- The pair was trading largely unchanged at 1.0728 at around 08:55 GMT
- Recovery attempts were capped at 200-DMA which has now turned stiff resistance at 1.0744
- Oscillators support weakness, Stochs and RSI are biased lower, RSI is well below 50 mark
- GMMA indicator shows major trend is turning bearish, while minor trend is bearish
- The pair is currently holding minor support at 1.0715, break below will drag prices lower
Support levels - 1.0715 (Rising trendline), 1.07, 1.0682 (50% Fib)
Resistance levels - 1.0744 (200-DMA), 1.0776 (55-EMA), 1.0782 (21-EMA)
Summary: AUD/NZD trades with a bearish bias. Breach at 200-DMA support has raised scope for weakness. The pair is holding support at 1.0715 (Rising trendline), watch for break below for dip till 61.8% Fib at 1.0620.


