


 FxWirePro: GBP/AUD downside pressure builds, key support level in focus
  Major Pairs Action Bias: USDCAD and USDCHF Stand Out as Extremely Bullish While GBPUSD and NZDUSD Turn Extremely Bearish
  FxWirePro: GBP/NZD maintains bersish bias with focus on 2.2900 level
  FxWirePro: GBP/AUD gains some upside momentum but still bearish
  FxWirePro: EUR/NZD up trend gains momentum but hurdles ahead
  FxWirePro: AUD/USD dips after RBA Governor speech
  FxWirePro: GBP/USD edges higher as traders await BoE guidance and UK fiscal clarity
  FxWirePro- Major Pair levels and bias summary
  FxWirePro- Woodies pivot (Major)
  FxWirePro: AUD/USD falls after softer-than-expected Australian Q2 CPI
  JPY Action Bias: USDJPY Emerges as the Clear Bullish Pair to Watch Amid Mixed Crosses
  FxWirePro: EUR/AUD outlook weaker on renewed downside pressure
  FxWirePro: EUR/ AUD gains some ground , but remains on bearish path
  FxWirePro: USD/ZAR retreats but trend is still bullish
  FxWirePro: USD/ZAR uptrend loses steam, remains on bullish path


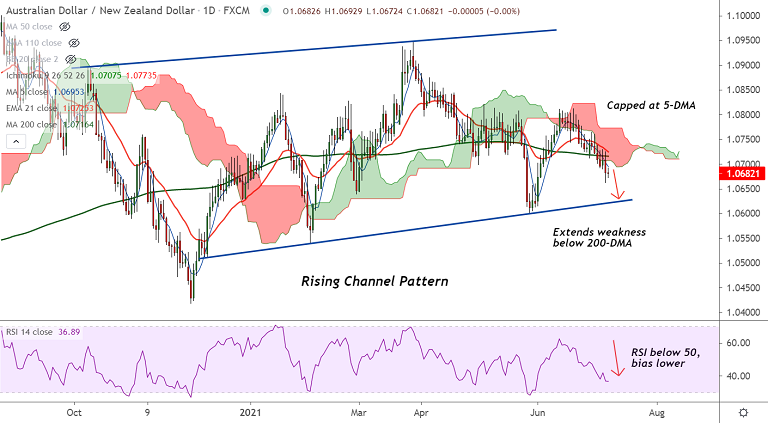
AUD/NZD chart - Trading View
Technical Analysis: Bias Bearish
- AUD/NZD has edged higher from session lows at 1.0672 and was trading at 1.0683 at around 10:40 GMT
- Daily cloud capped recovery attempts and the pair is grinding lower along 5-DMA
- Price action is extending weakness below 200-DMA and is trading below 200H MA
- Volatility is high and rising as evidenced by widening Bollinger bands
- ADX is rising with -ve DMI dominance in support of downside, MACD is below zero
- Momentum is bearish, RSI is well below 50 mark, Stochs are at oversold levels
- GMMA indicator shows major and minor trend are bearish on the daily charts
Support levels - 1.0683 (110-week EMA), 1.0625 (Channel base), 1.06 (May 27 low)
Resistance levels - 1.0695 (5-DMA), 1.0716 (200-DMA), 1.0725 (21-EMA)
Summary: Souring market sentiment amid rising coronavirus cases of the Delta variant keep the antipodeans depressed. The pair has formed a Doji on the daily candle at the time of writing.
Major technical bias is bearish, scope for test of channel base support at 1.0625. Retrace above 200-DMA could change near-term dynamics.


