
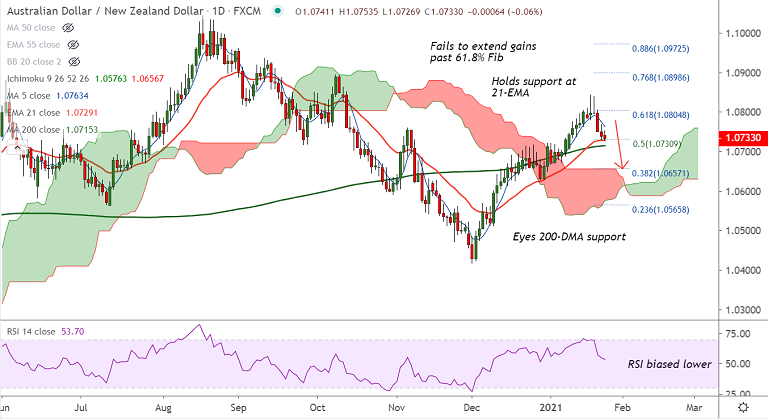
AUD/NZD chart - Trading View
Technical Analysis: Bias Bearish
- AUD/NZD on a downward spiral after successive Dojis on daily candles in the previous week
- Price has slipped below 5-DMA which has turned sharply lower
- Stochs and RSI are biased lower, momentum with the bears
- Price action is extending weakness below 200H MA and major moving averages on the intraday charts have turned bearish
- 'Death Cross' (bearish 50-MA crossover on 200-MA) on the hourly charts adds to the bearish bias.
Support levels - 1.0730 (nearly converged 20-DMA and 21-EMA), 1.0715 (200-DMA), 1.0692 (4H 200 MA)
Resistance levels - 1.0763 (5-DMA), 1.0783 (200H MA), 1.0828 (Upper BB)
Summary: Back-to-back Gravestone Doji formations on the daily candle last week dent upside in the pair. AUD/NZD is currently holding support at 21-EMA at 1.0730. Bearish momentum is set to drive prices lower. Scope for test of 200-DMA at 1.0715. Violation at 200-DMA support will open downside for the pair.


