


 FxWirePro: USD/CAD slips after Fed holds rates steady
  European Stocks Rally on Chinese Growth and Mining Merger Speculation
  JPY Currency Meter Signals: NZDJPY Bullish (+25) vs CHFJPY (-100) – These Pairs Could Move Next
  FxWirePro : GBP/NZD strongly bearish despite upside attempts
  Energy Sector Outlook 2025: AI's Role and Market Dynamics
  FxWirePro: NZD/USD consolidates overnight gains, but loses momentum
  US Gas Market Poised for Supercycle: Bernstein Analysts
  China’s Growth Faces Structural Challenges Amid Doubts Over Data
  Fed May Resume Rate Hikes: BofA Analysts Outline Key Scenarios
  Geopolitical Shocks That Could Reshape Financial Markets in 2025
  JPY Action Bias: EURJPY and CADJPY Emerge as Extremely Bullish Pairs to Watch
  Global Markets React to Strong U.S. Jobs Data and Rising Yields
  Major FX Action Bias & US Market Sentiment: NZD/USD (Extremely Bullish) & AUD/USD (Bullish) Watchlist
  FxWirePro- Woodies pivot (Major)
  Moody's Upgrades Argentina's Credit Rating Amid Economic Reforms
  FxWirePro: GBP/USD rises as soft US data pressures dollar
  AUD/JPY Slips Below 112 as BOJ Intervention Sparks Bearish Momentum: Sell the Rallies


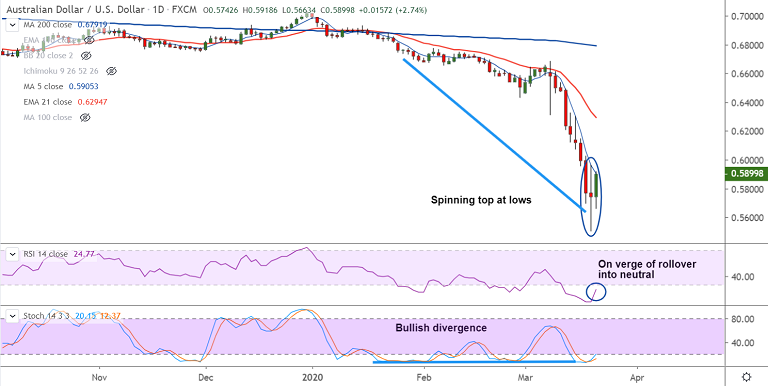
AUD/USD chart - Trading View
AUD/USD was trading 2.56% higher on the day at 0.5889 at around 06:15 GMT, bias is turning slightly bullish.
The pair has bounced off from fresh multi-year lows on Thursday's trade with a 'Spinning Top' formation.
Further, bullish Stochastics divergence on the daily charts keeps scope for further gains.
Aussie bulls buoyed by the Australian authorities' massive stimulus measures rolled out to battle the virus impact on the economy.
Signs of risk recovery were also evident across the globe in the rebound in the Asian equities and US stocks futures.
Technical studies show nascent signs of recovery. Stochs and RSI are still in oversold zone, but have turned north.
Price action has broken above hourly cloud and 55H EMA. Next immediate hurdle lies at 110H EMA at 0.5951.
Break above 110H EMA eyes 200H SMA at 0.6172. Further upside only on decisive break above.
Support levels - 0.5835 (55H EMA), 0.5715 (cloud base), 0.55 (88.6% Fib)
Resistance levels - 0.5904 (5-DMA), 0.5950 (110H EMA), 0.6172 (200H MA)


