


 FxWirePro- Woodies pivot (Major)
  GBPJPY Slips After Sterling Weakness, Bears Eye 216
  FxWirePro: GBP/USD edges higher as traders await BoE guidance and UK fiscal clarity
  FxWirePro: NZD/USD edges lower, remains on back foot
  Major Pair Action Bias: Bullish Pairs to Watch Out For
  AUDJPY Action Bias: Bullish Dip-Buy Setup Despite Flat Neutral Bias
  FxWirePro: USD/ZAR uptrend loses steam, remains on bullish path
  Major Pairs Action Bias: USDCAD and USDCHF Stand Out as Extremely Bullish While GBPUSD and NZDUSD Turn Extremely Bearish
  JPY Action Bias: USDJPY Emerges as the Clear Bullish Pair to Watch Amid Mixed Crosses
  FxWirePro- Major Crypto levels and bias summary
  EUR/USD Bounces from Monthly Low, But Bearish Pressure Remains
  FxWirePro: EUR/NZD up trend gains momentum but hurdles ahead
  FxWirePro: AUD/USD dips after RBA Governor speech
  FxWirePro- Major Pair levels and bias summary
  FxWirePro: GBP/NZD gains some ground but bias is still bearish
  AUDJPY Weakness Deepens: Sell Rallies Toward 112 as Aussie Dollar Falters


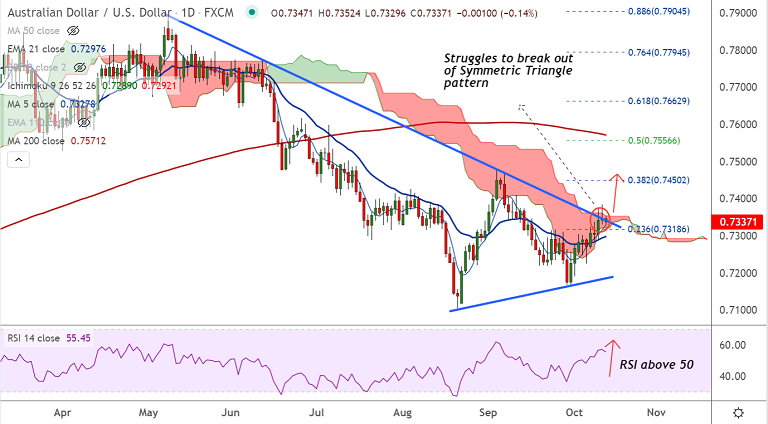
AUD/USD chart - Trading View
Spot Analysis:
AUD/USD was trading 0.12% lower on the day at 0.7338 at around 04:30 GMT
Previous Week's High/ Low: 0.7338/ 0.7226
Previous Session's High/ Low: 0.7384/ 0.7332
Fundamental Overview:
China posted a trade surplus of $66.76 billion in September, beating forecast for a $46.8 billion surplus by a large margin. Trade surplus stood at $58.34 billion in August.
Details of the report showed exports rose 28.1% from a year earlier, while imports increased 17.6%, lagging an expected 20% gain forecasted.
The market sentiment is tepid amid stagflation worries. Investors turn cautious ahead of the key US inflation, Fed minutes and earnings reports.
Markets largely convinced that the Fed will begin rolling back its massive pandemic-era stimulus as soon as November.
FOMC minutes and CPI data are likely to influence near-term USD price dynamics and provide a fresh directional impetus to the AUD/USD pair.
Technical Analysis:
- AUD/USD on track to close in the green for the 3rd straight week
- Price action is extending bounce off 200-week MA support
- The major is currently struggling to break out of 'Symmetric Triangle' pattern
- Momentum is bullish and volatility is high, scope for further upside
Major Support and Resistance Levels:
Support - 0.7332 (55-EMA), Resistance - 0.7405 (110-EMA)
Summary: AUD/USD capped at 'Symmetric Triangle' top for the 3rd straight session. Decisive break above will fuel further upside.


