


Bearish engulfing on daily plotting, shooting star patterns have occurred on the weekly chart.
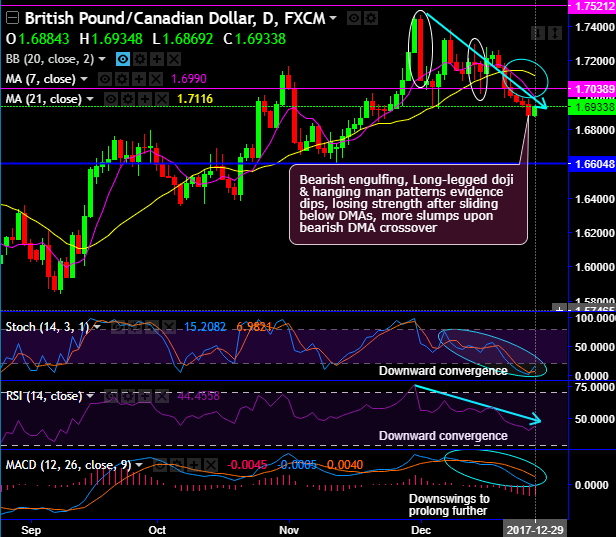
While daily chart, bearish engulfing, long-legged doji & hanging man have occurred at 1.7085, 1.7180 and 1.7135 levels respectively, as a result, these bearish patterns have evidenced considerable price dips, subsequently, previous upswings are losing strength after current prices sliding below DMAs.
For now, more dips on cards as 7DMA crosses below 21DMA which is a bearish crossover.
Bearish pressure is observed after consecutive shooting stars at 1.7085, 1.7191 and 1.6999 levels, consequently, the current prices are sliding below 7EMA. More bearish rout on the table upon the break below support at 21EMAs, it is witnessed continues streaks of bearish swings 3 weeks in a row.
Most importantly, both daily and weekly RSI oscillator signals bearish strength as we see consistent convergence to the prices decline on daily plotting and losing strength in the previous rallies on weekly terms.
While slow stochastic has also been indicating the same, the continuous downward convergence indicates intensified bearish momentum.
To substantiate, MACD signals the downtrend likely to prolong further.
As the robustness in both short and long-term bearish sentiment gets confirmation from both leading as well as lagging oscillators, you could see failure swings at the stiff resistance of 1.7505 levels followed by considerable price dips.
Well, having said that we wrap up with a concluding note, short-term aggressive bears can speculate this pair via tunnel spreads using upper strikes at 1.6990 and lower strikes at 1.6869, alternatively, long-term investors at current juncture contemplating above bearish indications, we advocate shorting futures contract of mid-month or near month expiries for target towards 1.6364 and 1.5749 or below levels cannot be ruled out upon breach of 1sttwo targets.
Writers in a futures contract are expected to maintain margins in order to open and maintain a short futures position.
Currency Strength Index: FxWirePro's hourly GBP spot index is at shy above 75 levels (which is bullish), while hourly CAD spot index is edging higher at 110 levels (bullish) while articulating (at 09:28 GMT). For more details on the index, please refer below weblink:
http://www.fxwirepro.com/currencyindex.
FxWirePro launches Absolute Return Managed Program. For more details, visit:


