


 BTCUSD Bullish Breakout: Clears 800-EMA After Consolidation, Buy Dips Toward $74,900
  FxWirePro: GBP/USD weighed down by renewed Middle East attacks
  NZDJPY Bulls Hold the Line: 92.60 Support Fuels Dip-Buy Setup to 95
  EUR/USD Slips Below 1.1380 as US-Iran Tensions Fuel Dollar Demand
  NZDJPY Smashes 4-Month High on Kiwi Buying Frenzy – Bullish Setup Remains Strong
  FxWirePro- Major Crypto levels and bias summary
  FxWirePro: NZD/USD advances as hawkish outlook by a top policy maker boosts kiwi dollar
  FxWirePro- Major Crypto levels and bias summary
  FxWirePro: USD/ZAR advances as risk-off sentiment pressures the rand
  FxWirePro- Woodies pivot (Major)


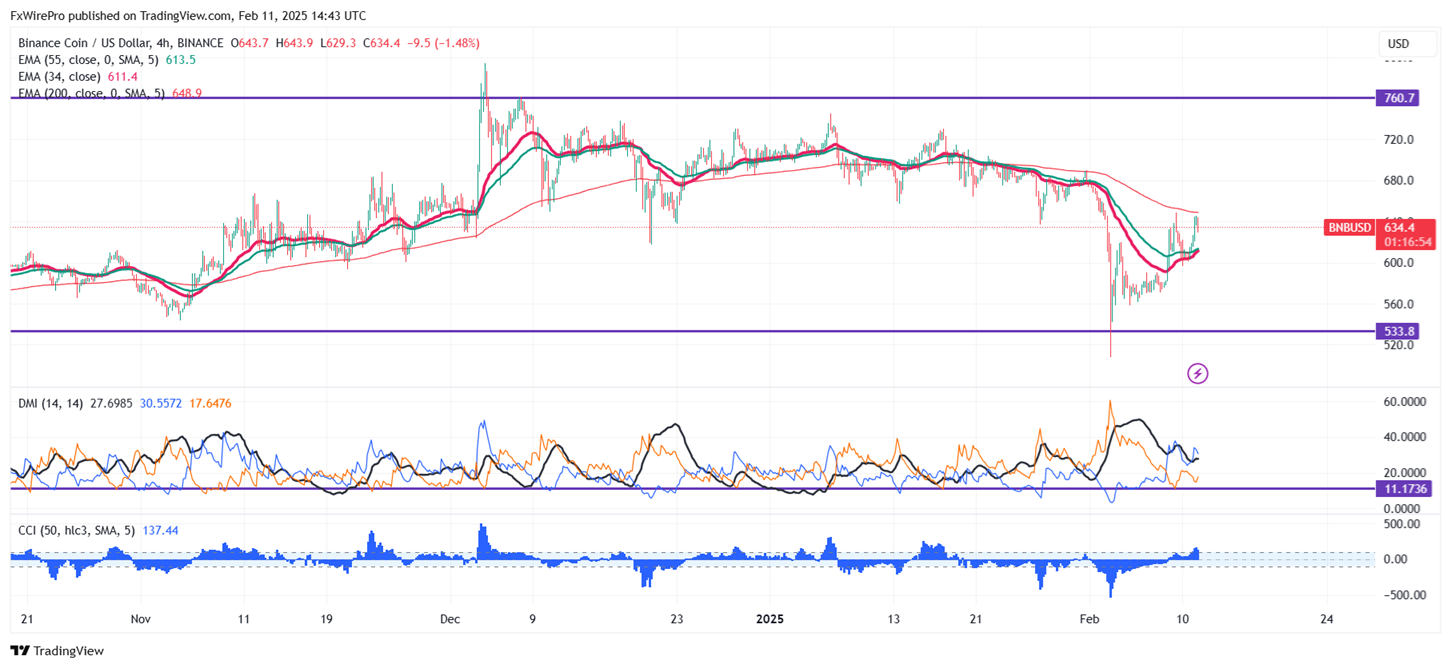
Key Level to Monitor: $660
BNB/USD pair showed a minor pullback after forming a minor bottom around $596. It hit an intraday high of $645 and is currently trading around $642.
Overall bias remains bullish as long as support of $500 holds. It trades above the 34 and 55 EMA on the 4-hour chart. If the pair closes below $590, potentially leading to further declines towards $580/$550/$500.
Immediate Resistance is at $660. A successful breakout above this resistance could suggest bullish momentum, with further gains possible towards $700/$725/$775/$812/$848/$1000.
Indicators (4-Hour Chart)
- Directional Movement Index: Bullish
- CCI (50): Bullish
Trading Strategy
Consider buying on dips around $600 with a stop-loss set at $500 and a target price of $1000.


