


 FxWirePro- Major Crypto levels and bias summary
  ETH Stands Alone Bullish; BTC, SOL, XRP, BNB Neutral
  FxWirePro:EUR/NZD stuck In narrow ranges, focus on near term support
  FxWirePro:EUR/NZD dips below lower range, bearish bias increases
  FxWirePro: GBP/NZD gains some upside momentum but still bearish
  FxWirePro: USD/ZAR advances as South African rand weakens amid renewed Middle East tensions
  JPY Action Bias: Extremely Bullish Surge Ignites Across NZD, GBP & AUD
  FxWirePro: GBP/USD hits one-month high, scope for further upside
  FxWirePro- Major Crypto levels and bias summary
  JPY Action Bias: CADJPY Turns Extremely Bullish While Other Pairs Hold Positive Ground


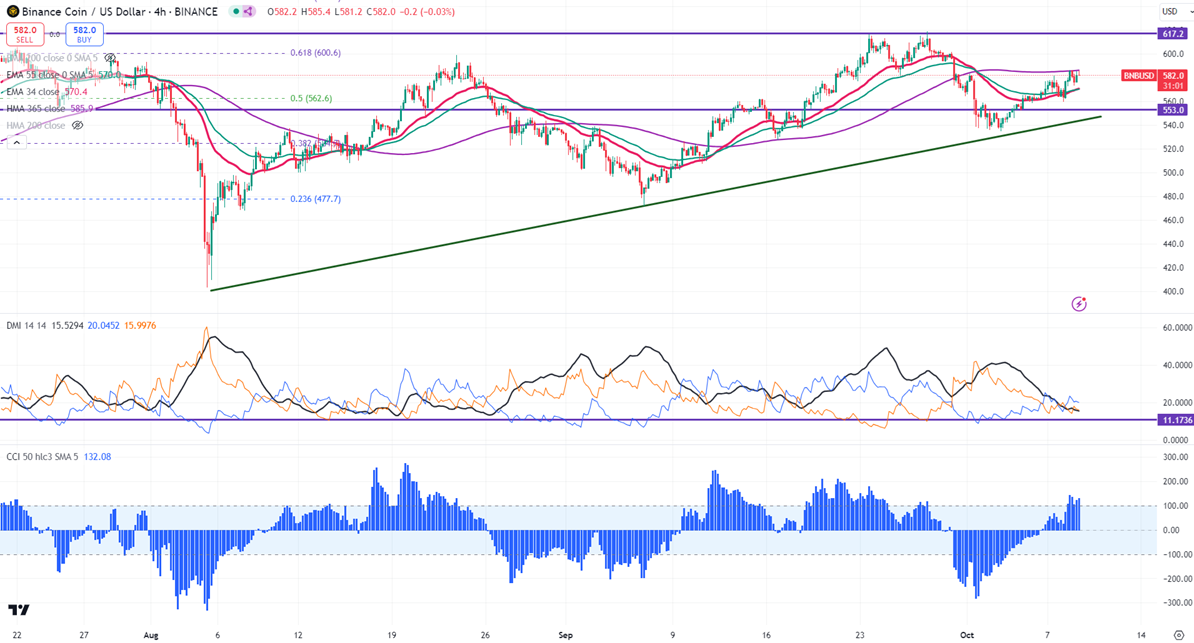
Intraday bias - Bullish
Trend reversal level- $531 (200- day EMA)
Any close above $620 confirms a bullish continuation.
BNBUSD trades flat after a minor pullback. It hits a high of $586.30 at the time of writing and is currently trading around $581.40.
The pair holds above 34 and 55 EMA in the daily chart. Intraday bullishness can be seen if it breaks above 586.90 (365 Hull EMA). The bullish trend continuation can happen if the pair closes above $615 in the daily chart. On the lower side, the near-term support is $560 (resistance turned into support). Any break below targets $540/$528/$500/$470 is possible.
The immediate resistance stands at around $587. Any breach above confirms minor bullishness. A jump to $605/$620/$647/$700 is possible. A surge past $725 will take it to $800.
Indicators ( 4- hour chart)
Directional movement index - Neutral
CCI (50)- Bullish
It is good to buy on dips around $560 with SL around $528 for TP of $700.
a


