


 FxWirePro- Major Crypto levels and bias summary
  FxWirePro- Major Crypto levels and bias summary
  FxWirePro- Major Crypto levels and bias summary
  Crypto Major Pair Action Bias: ETHUSD Bullish as BTCUSD, SOLUSD & XRPUSD Stay Neutral


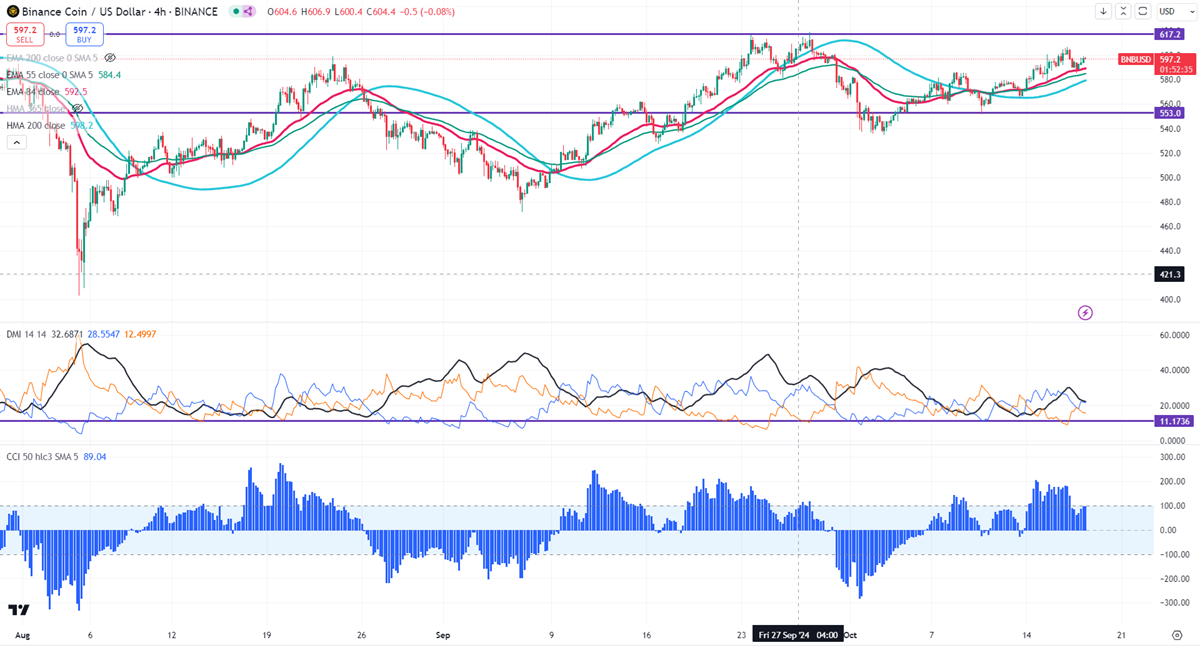
Intraday Outlook - Bullish
Key Level to Monitor: $550
A close above $620 will signal a continuation of the bullish trend.
BNB/USD pulled back slightly after reaching a minor peak around $605. It dipped to $585 yesterday and is now trading at roughly $597.20. Since its recent low of $403, the pair has appreciated over 50%.
The momentum remains strong, with prices remaining above the 34 and 55 EMA on the 4-hour chart. To sustain the bullish trend, it’s crucial to close above $620, while a drop below $551 could indicate a bearish reversal. Near-term support is at $585; failing this level may lead to potential downside targets of $560, $550, $540, $528, $500, and $470.
Current resistance is near $605, and breaking above this level could indicate minor bullish strength. If the price exceeds $620, further gains to $647 or even $700 could be possible, with the potential to reach $800 if it surpasses $725.
Indicators (4-hour chart)
- Directional Movement Index: Neutral
- CCI (50): Bullish
It is recommended to buy on dips around $560, with a stop-loss set at $528 and a target price of $700.


