


 BTC’s Bear Bounce: Sell the Rally Near $66K as Bears Target $59K–$52K Breakdown
  Ethereum Cracks Under $1,700: Sell the Rally Near $1,750 as Bears Eye $1,380–$1,200


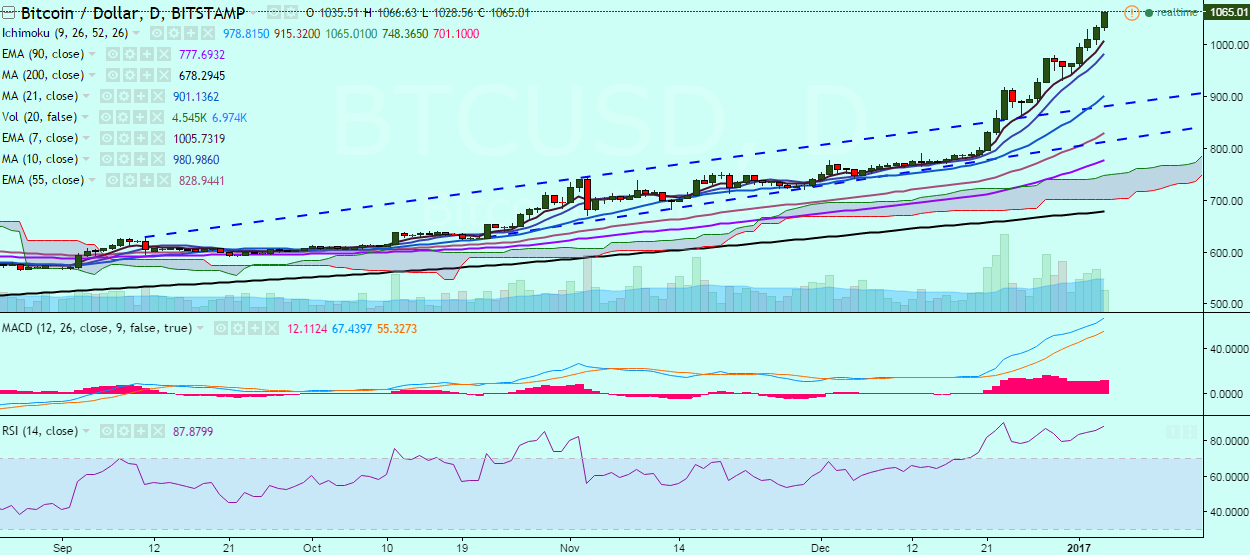
BTC/USD has broken above our previous target of 1,050 and is currently trading at 1,065 levels at the time of writing.
Long-term trend: Bullish
Short-term trend: Bullish
Ichimoku analysis of daily chart:
Tenkan Sen: 963.50
Kijun Sen: 901.50
Trend reversal: 771.23 (90 EMA)
On the upside, the pair will run into resistance at 1074.30(161.8% extension of 670.32 and 920) and a break above would target 1080 levels (300% retracement of 980.74 and 931)/1100.
Momentum studies remain bullish for the pair – the MACD line still above the signal line and RSI(14) is at 87.92 – suggesting further uptrend is likely to follow.
On the reverse side, the pair is likely to take support at 985.97 (7-EMA) and a break below would see it testing 963.55 (10-DMA)/931 (December 30 low).

- News

- Economy

- Central Banks
- Investing
- Research
- Roundups
- Digital Currency
- Insights
- Technical Analysis
- Technology
- Business
- Law
- Health
- Nature
- Fintech
- Science
- Topic
- Opinions
- ©Econometrics LLC . All Rights Reserved.
FxWirePro: BTC/USD breaches 1,050, jump till 1,100 likely
Wednesday, January 4, 2017 10:16 AM UTC
Editor's Picks


- Market Data
Most Popular


