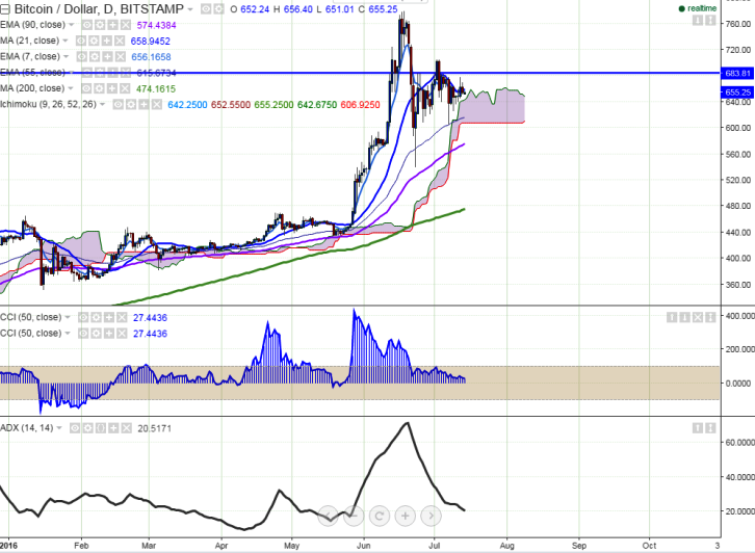
FxWirePro: BTC/USD faces strong resistance at $685, good to buy on dips
BTC/USD is consolidating in a narrow range between $678 and $651 for the past two trading session. It is currently trading at $654.16 levels at the time of writing (Bitstamp). Ichimoku analysis (Daily chart): Tenkan-Sen …
BTC/USD is consolidating in a narrow range between $678 and $651 for the past two trading session. It is currently trading at $654.16 levels at the time of writing (Bitstamp).
Ichimoku analysis (Daily chart):
Tenkan-Sen level: $643.93
Kijun-Sen level: $659.51
Trend reversal level - (90 EMA)-$572
“BTC/USD is facing strong support at $643 (daily Tenkan-Sen). It should break below this level for further weakness”, FxWirePro said in a statement.
Both Long- and short-term trend remain bullish for the pair. Major resistance is around $685 (Jun 25 high) and any break above will take the pair to $705 (Jul 2 high)/ $731 (161.8% retracement of $778 and $540). On the flipside, short-term support is seen at $643 (daily Tenkan-Sen) and any violation below will drag the pair till $612 (55 day EMA)/$540 (Jun 23 low).