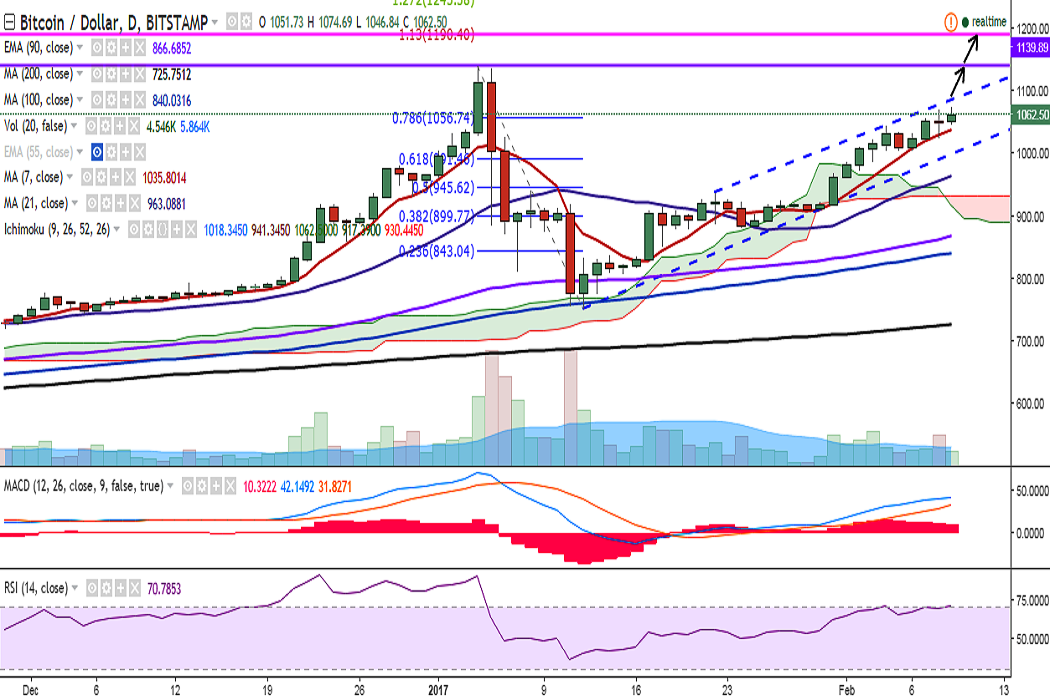
BTC/USD hit a high of 1074.69 levels on Thursday and is currently trading at 1062 levels at the time of writing (Bitstamp).
Ichimoku analysis of daily chart:
Tenkan Sen: 993.75
Kijun Sen: 939
Trend reversal: 862.28 (90 EMA)
The weakness in the pair seen yesterday, following PBoC's meeting with bitcoin exchanges was short-lived and the pair has reversed its losses.
On the upside, the pair faces immediate resistance at 1085 levels (trend line joining 937.74 and 1044.23) and a break above would see it testing 1139.89 levels (January 04 high)/1190 (113% retracement of 1139.89 and 751.34).
Momentum studies remain bullish: RSI(14) is strong at 71; and MACD line is above signal line. Moreover, the pair is successfully holding above 7-DMA.
However, traders are advised to be little cautious as Stochs are in the overbought zone. Any close below 7-DMA could see some weakness in the pair.
On the downside, the pair has taken support near 1028.18 (7-DMA) and any violation would drag it to 998 (trend line joining 751.34 and 910)/975 (23.6% retracement of 751.34 and 1044.23).