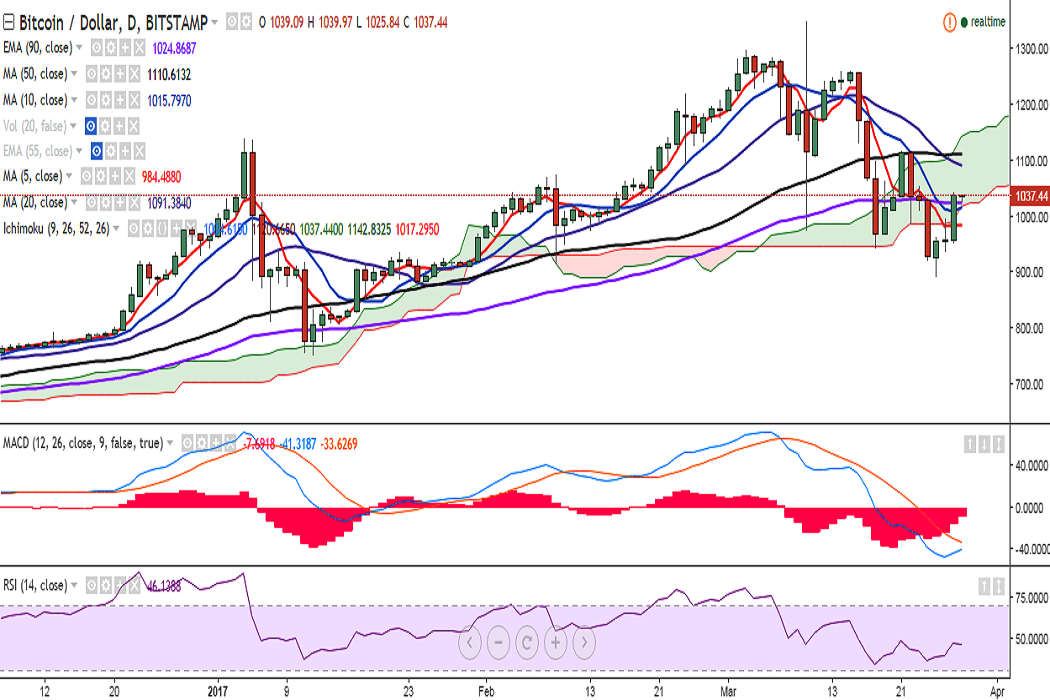
BTC/USD is trading in a narrow range, between 1025 and 1050 levels, after it hit 1043 levels on Monday, March 27. It is currently trading at 1036 levels at the time of writing (Bitstamp).
Ichimoku analysis of daily chart:
Tenkan Sen: 1004.61
Kijun Sen: 1120.66
The pair has currently moved back inside Ichimoku cloud and bullishness could be confirmed only if it breaks above 50-DMA.
On the upside, resistance is now seen at 1066.54 (38.2% retracement of 1350 and 891.33) and a break above would see it testing 1110.34 (50-DMA)/1120.67/1175.
In the daily chart, support is seen at 1024.58 (90-EMA) and a break below would drag the pair to 982.93 (5-DMA)/930.37 (61.8% retracement of 751.34 and 1220).