FxWirePro: BTC/USD takes support near 550, good to buy on dips
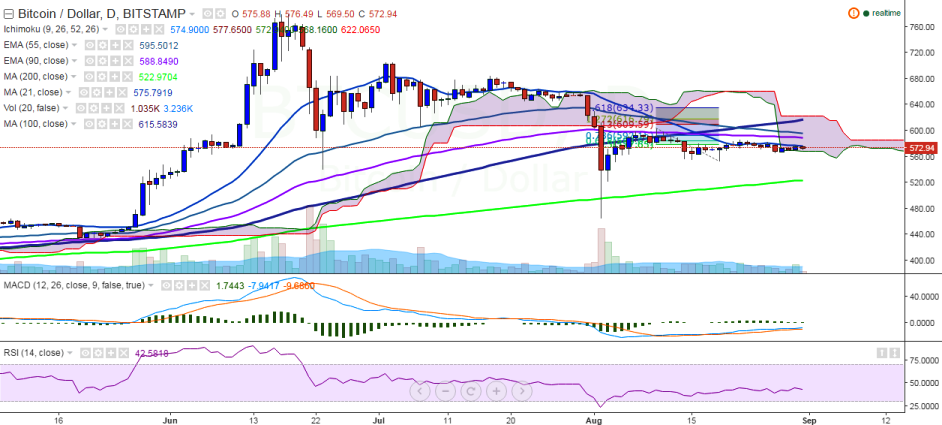
BTC/USD continues to trade flat in the absence of any major market moving news. It has been trading between 565 and 585 levels from the past couple of days. It is currently trading at 572 levels at the time of writing (B…
By Shampa Mani
Updated 1 min read
Image from the original EconoTimes article
BTC/USD continues to trade flat in the absence of any major market moving news. It has been trading between 565 and 585 levels from the past couple of days. It is currently trading at 572 levels at the time of writing (Bitstamp).
Ichimoku analysis of daily chart:
Tenkan Sen: 575.38
Kijun Sen: 577.65
Trend reversal: 589.20 (90 EMA)
“The pair has taken support near 550 and has failed to break below this level. So, a slight jump till 590/600 levels is likely”, FxWirePro said in a statement.
Long-term trend is bullish for the pair, while short-term trend remains weak. BTC/USD faces major resistance 589.20 (90 EMA) and a break above would target 614.28 (100-day MA)/ 634 (161.8% retracement of 603 and 552.30). On the other hand, support is seen at 550 (psychological level) and a break below would target 522 (200-day MA)/465.28 (August 2 low).
She said the bill set a $50 million annual cap and a $200 million lifetime ceiling. The Senate’s 49-50 vote was on cloture for a motion to proceed, not final passage.
He said stablecoins have narrowed Bitcoin’s role as a medium of exchange or unit of account, while expected data-center returns may make assets without immediate payoffs less attractive.