


 Energy Sector Outlook 2025: AI's Role and Market Dynamics
  Bank of America Posts Strong Q4 2024 Results, Shares Rise
  FxWirePro- Major Crypto levels and bias summary
  UBS Projects Mixed Market Outlook for 2025 Amid Trump Policy Uncertainty
  US Gas Market Poised for Supercycle: Bernstein Analysts
  UBS Predicts Potential Fed Rate Cut Amid Strong US Economic Data
  Crypto Major Pair Action Bias: ETHUSD Bullish as BTCUSD, SOLUSD & XRPUSD Stay Neutral
  Goldman Predicts 50% Odds of 10% U.S. Tariff on Copper by Q1 Close
  Lithium Market Poised for Recovery Amid Supply Cuts and Rising Demand
  Moody's Upgrades Argentina's Credit Rating Amid Economic Reforms
  Trump’s "Shock and Awe" Agenda: Executive Orders from Day One
  Oil Prices Dip Slightly Amid Focus on Russian Sanctions and U.S. Inflation Data


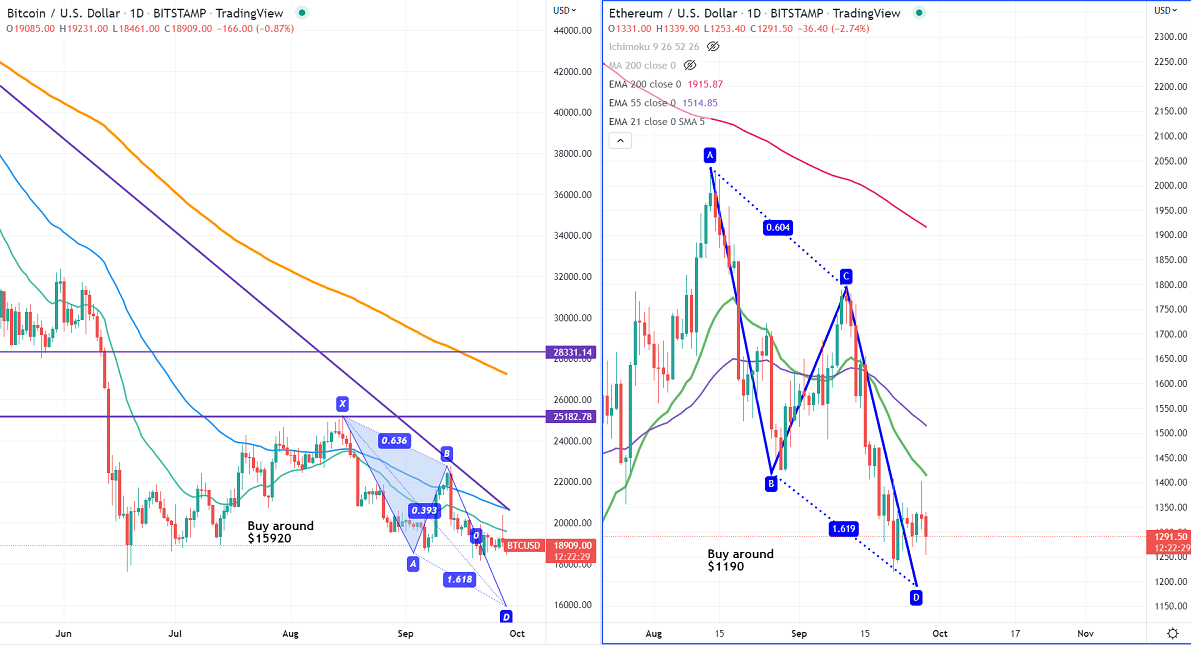
Harmonic chart pattern- Bullish AB=CD Pattern (BTCUSD and ETHUSD)
BTCUSD and ETHUSD trading weak for the past 17 days and lost 20. 39% and 31% respectively on cryptocurrency weakness. The demand for riskier assets dropped sharply after a hawkish rate hike by Fed.
Central bank's action-
The U.S federal reserve has been aggressive in hiking rates to tackle inflation. The central bank hiked rates by 0.75 percentage points for the third consecutive time. The European Central Bank increased rates by 125 basis points at its past two meetings. The Swiss national bank also raised its policy rates by 75 bpbs to 0.50%.
Other central banks which hiked rates are the Central bank of the Republic of Turkey, Bank of England, Norway, and Sweden.
Global Treasury yields-
|
COUNTRY |
YIELD |
1 DAY |
1 MONTH |
1 YEAR |
|
United States |
4.00% |
4 |
96 |
246 |
|
Canada |
3.32% |
0 |
30 |
182 |
|
Brazil |
12.05% |
1 |
-19 |
93 |
|
Mexico |
9.81% |
0 |
93 |
249 |
|
|
|
|
|
|
|
Germany |
2.34% |
12 |
94 |
252 |
|
4.54% |
4 |
195 |
355 |
|
|
France |
2.94% |
11 |
91 |
278 |
|
Italy |
4.88% |
15 |
119 |
403 |
|
Spain |
3.53% |
11 |
93 |
308 |
|
Netherlands |
2.64% |
11 |
92 |
272 |
|
Portugal |
3.41% |
10 |
92 |
306 |
|
Greece |
5.04% |
16 |
111 |
422 |
|
Switzerland |
1.51% |
5 |
76 |
171 |
Overall crypto markets are negatively correlated with global treasury yields. The massive jump in treasury yields has dragged stock markets down which in turn pushed Crypto markets lower.
US dollar index- It is trading higher for a third consecutive month and surged more than 1300 pips on safe-haven demand.
Technical analysis-
RSI in Monthly chart-
US dollar index- 81.49 (Overbought)
Bearish divergence in the monthly chart (CCI- 50) (positive for BTC)
US 10-year yield- 76.29
Bearish divergence in the monthly chart (CCI- 50).
US indices-
NASDAQ - 42.76. Significant selling below 10978 (positive correlation with Crypto markets).
BTCUSD-
The pair is consolidating in a narrow range after a massive sell-off to $17467. Bearish invalidation if it breaks $25250. Any breach above will take the pair to next level of $29715/$33336/$37150. Major bullish continuation only above $50000.
The near-term support stands around $17500, any violation below targets $15000/$12940/$8166.
It is good to buy on dips around $15900-920 with SL around $8250 for TP of $50000.
RSI - 41.60 (Monthly chart)
ETHUSD-
The pair is struggling to give clear direction after declining more than 80% from its all-time high of $4868. Minor bullishness can be seen only if it breaks the $1500 level. Any surge past $1500 will take the pair to next level $1790/$2150. A jump above targets $3580.
The near-term support stands around $1190, and any violation below targets $880/800.
It is good to buy on dips around $1190 with SL around $880 for TP of $2150/$3500.


