


 FxWirePro: NZD/USD consolidates overnight gains, but loses momentum
  FxWirePro: USD/CNY dips to hit three year low,scope for further downside
  FxWirePro: USD/CAD retreats after Canada posts stronger-than-expected GDP growth
  JPY Currency Meter Signals: NZDJPY Bullish (+25) vs CHFJPY (-100) – These Pairs Could Move Next
  FxWirePro- Woodies pivot (Major)
  Nikkei Surges Past 65,000 on Suspected Yen Weakness: Tech Giants Like Advantest and NEC Lead Explosive Gains
  FxWirePro: GBP/AUD drifts lower after BOE rate decision
  US Magnificent 7 Stocks Trend Score: Amazon & Microsoft Hit Extreme Bullish (+100) as Meta Drops to -100 — Key Resistance & Support Watchlist
  FxWirePro: GBP/USD rises as soft US data pressures dollar
  Major European Indices Score Extremely Bullish: DAX Eyes 26000, CAC Targets 8600, FTSE100 at 11000 – Key Levels to Watch
  FxWirePro: GBP/NZD remains weak, eyes 38.2%fib support
  FxWirePro: USD/JPY dips as market assess risk of additional FX intervention.
  FxWirePro- Major Crypto levels and bias summary
  FxWirePro: GBP/AUD bears maintain upper hand
  FxWirePro: EUR/ AUD dips below 1.6400 level, focus on near term support
  NZDJPY Retreats on Yen Strength – Bearish Setup Targets 90 After Hitting 92.75 Low


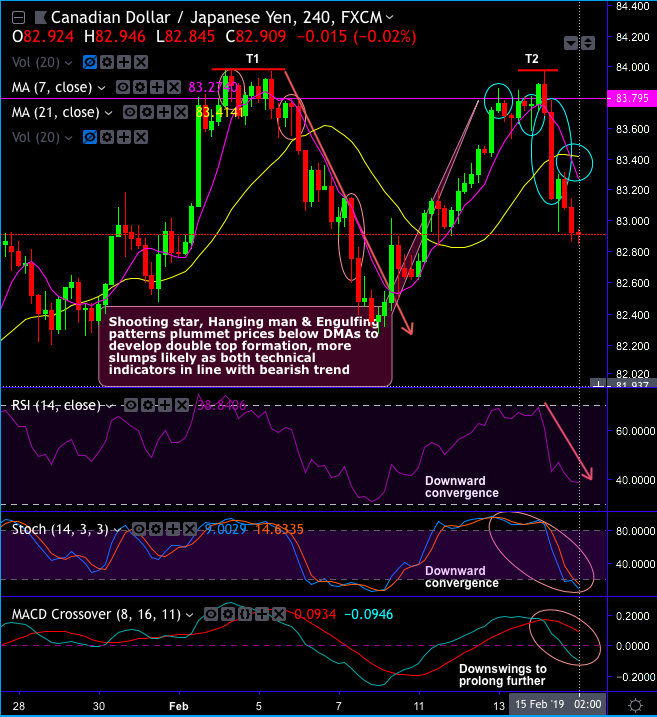
Take a Glance at Technical analysis: CADJPY forms shooting star, hanging man and bearish engulfing patterns at 83.762, 83.756 and 83.144 levels respectively on the daily chart. These streaks of bearish patterns nudge the current price way below DMAs and develop double top formation which is again a bearish chart pattern in nature.
For now, more slumps seem to be on cards as both technical indicators in line with the ongoing bearish trend.
Both the leading & lagging oscillators indicate momentum and bearish trend continuation.
RSI and stochastic curves show downward convergence to the price dips that indicates strength and intensified momentum in the prevailing downswings. While bearish DMA & MACD crossovers indicate downtrend to prolong further.
The stiff resistance zone is observed at 83.191 levels, the current price remains well below DMAs despite today’s mild rallies.
On a broader perspective, the intermediate trend of this pair which is in a consolidation phase since December 2015 has now been forming head and shoulder chart pattern and above stated bearish engulfing pattern drag slumps to develop this pattern (refer weekly plotting).
Head at 91.638, left shoulder at 88.922 and right shoulder at 87.851 levels. Shooting star pattern pops-up at that juncture hampers previous bullish momentum on this timeframe. Ever since then steep price slumps slide below EMAs.
Momentum study: RSI and Stochastic curves show downward convergence entering into the oversold zone that indicates the bearish momentum even on this timeframe.
Overall, the downtrend remains intact amid mild rallies, hence, it is wise to snap deceptive rallies so as to provide a better entry level for the fresh short trades.
Trade tips: Well, on trading perspective, at spot reference: 82.939 levels, contemplating above-stated bearish patterns, we advocate deploying tunnel spread option strategy using upper strikes at 83.015 and lower strikes at 82.800 levels, the strategy is likely to fetch leveraged yields as long as the underlying spot FX keeps dipping on but remains above lower strikes on the expiration.
Alternatively, on hedging grounds, we advocate shorting futures contracts of mid-month tenors as the underlying spot FX likely to target southwards 80.500 levels in the near terms.
Writers in a futures contract are expected to maintain margins in order to open and maintain a short futures position.
Currency Strength Index: FxWirePro's hourly CAD spot index is inching towards -83 levels (which is bearish), while hourly JPY spot index was at 75 (bullish) while articulating (at 05:52 GMT).
For more details on the index, please refer below weblink: http://www.fxwirepro.com/currencyindex


