


 FxWirePro- Major Pair levels and bias summary
  Economic pessimism has set in – but there are reasons for Australians to be hopeful
  Silver Cracks Key 365-Day EMA for First Time Since Feb 2024; Bears Eye $50 on Rallies
  Should I take zinc or eat oysters to ward off colds, boost my immune system or improve fertility?
  FxWirePro: NZD/USD holds narrow range, scope for downward resumption
  GBPJPY Surges Past Trendline Resistance, Signaling Bullish Momentum
  NZDJPY: Yen Weakness Fuels Rise, Key Resistance at 92.40 Holds Key
  Despite its best efforts, Iran won’t be able to toll the Strait of Hormuz. Here’s why
  FxWirePro: AUD/USD holds narrow range, focus on near-term support
  Europe Heatwave Creates Growth Opportunity for Carrier, Trane, and Johnson Controls, Citi Says
  FxWirePro: USD/CAD loses momentum but bullish setup remains
  FxWirePro: USD/ZAR changes short term trend from neutral to bearish
  Gold Flashes Bullish Signals Amidst Shifting Technical Landscape


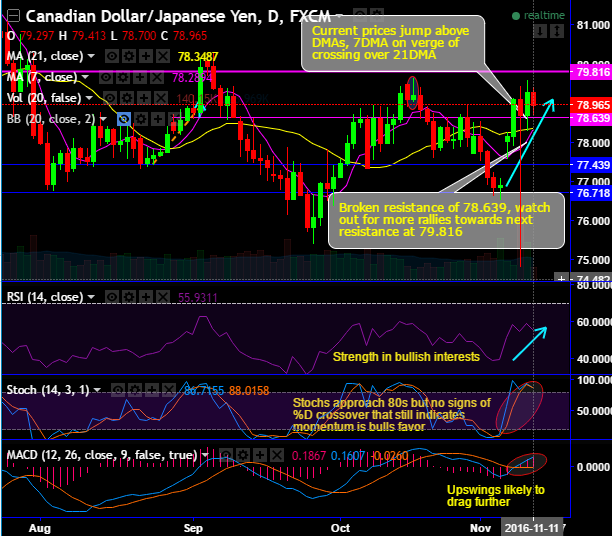
On daily terms, the current prices jump above DMAs, 7DMA is on the verge of crossing over 21DMA which is bullish signal
Bulls have broken the resistance of 78.639, for now, you could watch out for more rallies towards next resistance at 79.816.
RSI on daily terms: Upward convergence to the price upswings signals the strength in bullish interests.
Stochastic on daily terms: Stochastic curves approach 80s but no clear signs of %D crossover that still indicates momentum is bulls favor.
MACD: bullish crossover indicates the prevailing upswings likely to drag further.
On broader perspectives, it is most likely to form hammer in this weeks candle, hence bulls likely to uptrend to prolong.
RSI on monthly terms: You could probably make out the divergence to the major downtrend that would imply that there could be some upside potential in short run, but this should not be deemed as the reversal trend.
Stochastic: To substantiate the bullish stance, %K crossover indicates intensified bullish momentum.
Overall, short term longs are encouraged, while long-term bulls for fresh longs are yet to for the better clarity.


