Gold -
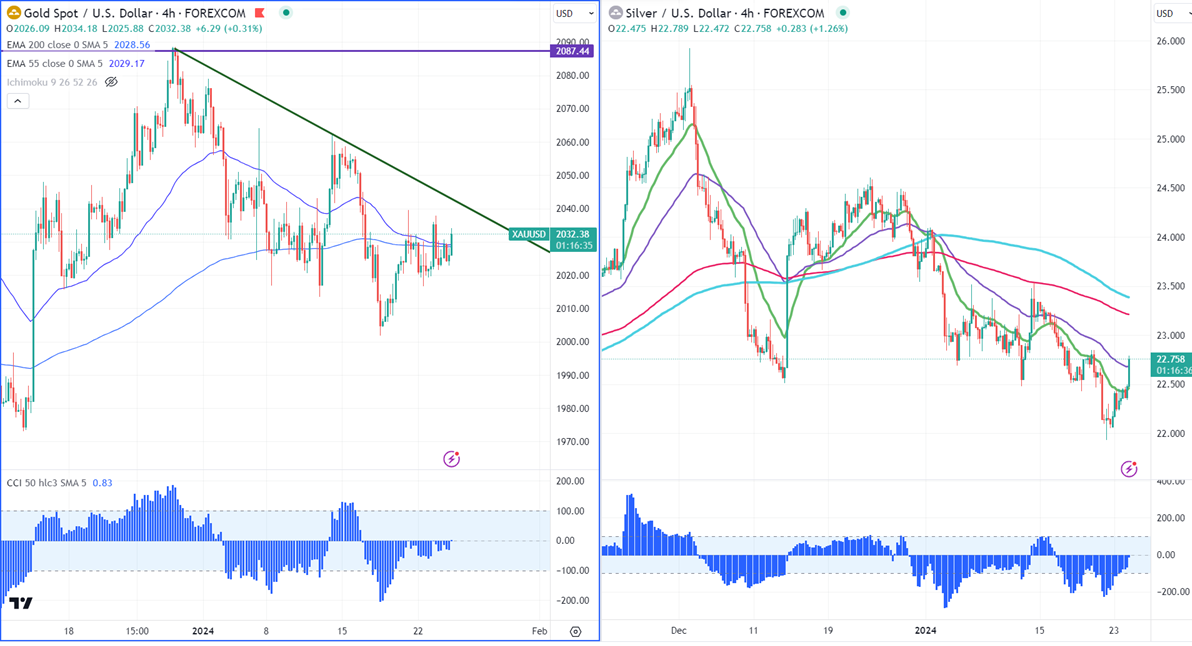
Ichimoku Analysis (4-hour chart)
Tenken-Sen- $2028.54
Kijun-Sen- $2022.68
Gold has traded in a narrow range of $2039.48 and $2016 for the past three days. US Richmond fed manufacturing index dropped to -15 vs. Expected -8. The yellow metal hit a high of $2039.48 and is currently trading around $2030.75.
According to the CME Fed watch tool, the probability of a no-rate cut in Jan decreased to 96.90% from 97.90% a day ago.
US dollar index- Bullish. Minor support around 103/102.40 The near-term resistance is 103.75/104.50.
Factors to watch for gold price action-
Global stock market- Bullish (negative for gold)
US dollar index - Bullish (Bearish for gold)
US10-year bond yield- Bullish (negative for gold)
Technical:
The near–term support is around $2000, a break below targets of $1970/$1956. The yellow metal faces minor resistance around $2040 and a breach above will take it to the next level of $2050/$2062/$2078.
It is good to buy on dips around $2015-16 with SL around $1998 for TP of $2065/$2080.
.
Silver-
Silver is trading higher for the second consecutive day after a massive sell-off. The minor decline in the US dollar index supports the silver price at lower levels. It trades below 21 and 55- EMA and long-term MA (200- MA) in the 4-hour chart. Any break below $21.90 confirms a bearish continuation. A decline to $20.68/$19.90 is possible. It is facing immediate resistance around $22.85. Any break above targets $23.55/$24.
Crude oil-
WTI crude oil prices gained momentum on US production outage and escalation of tension in the Middle -East. Markets eye EIA crude oil inventory.
Major resistance- $75.5/80. Significant support- $70/$68
Economic calendar
Economic calendar
Jan 24th, 2024 US Flash manufacturing PMI (2:45 pm GMT)
BOC monetary policy and US Flash manufacturing PMI (2:45 pm GMT)